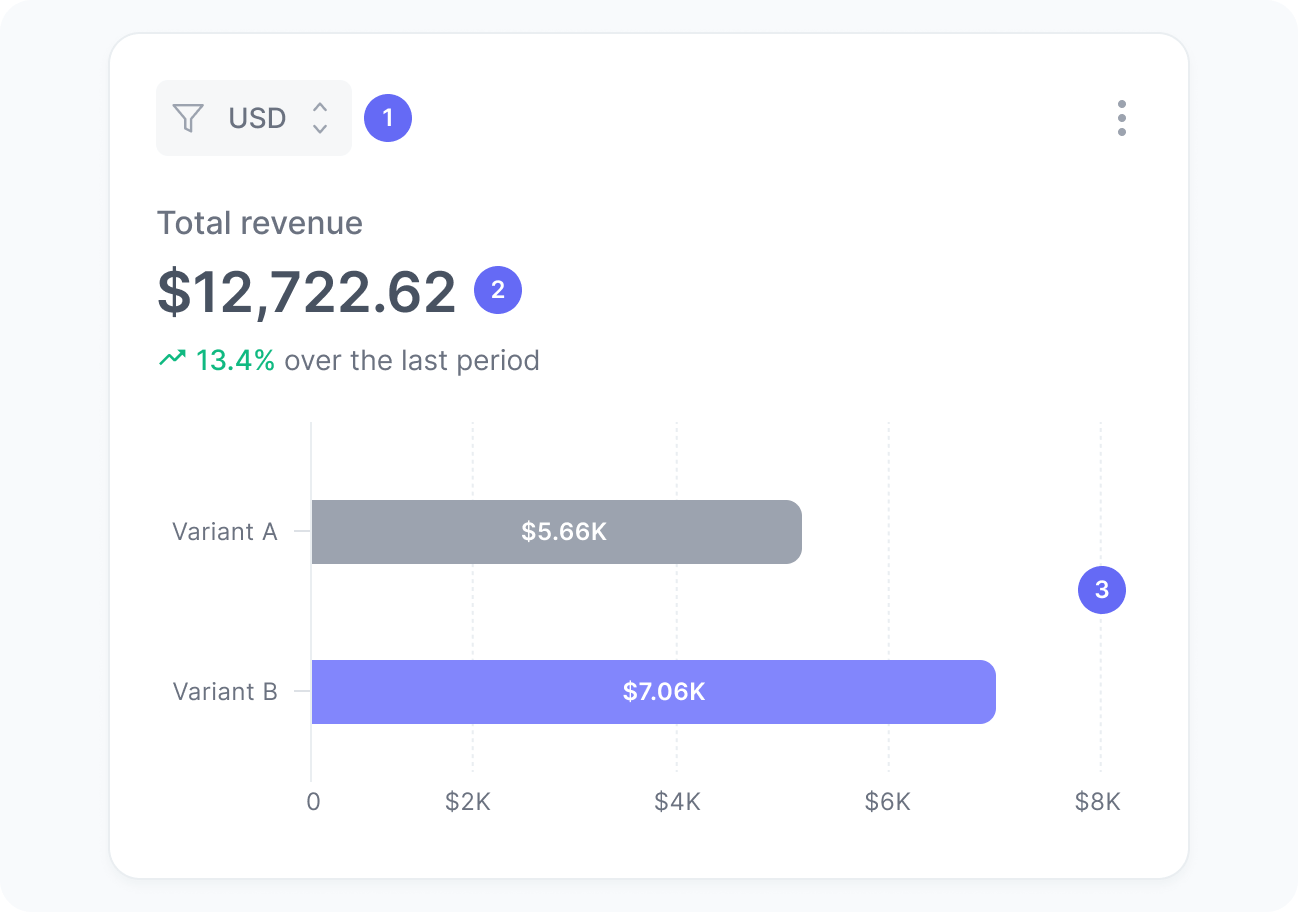
Total revenue
Measure the impact of your experiment on revenue.
Tracking required
Track the Order placed event to feed data into this widget.
This chart shows the total revenue generated by your experiment, broken down by variants. It helps you assess how different versions of your experiment impact purchasing behavior and overall sales performance.
Metrics
The chart includes:
- Currency
A filter to select orders in a specific currency. Values are never aggregated across currencies. - Revenue
The total revenue from completed orders within the experiment. - Revenue per variant
A breakdown of total revenue by experiment variant.
Interpretation
This chart helps you understand how effectively each experiment variant contributes to generating revenue. For example, if Variant B consistently shows higher revenue than Variant A, it may indicate that the changes introduced in Variant B are positively influencing user purchasing behavior.
What the number tells you
Here are some common insights you can get from this widget:
- A higher revenue for a given variant suggests that its content, design, offer, or messaging drives purchases more effectively.
- A lower revenue for a given variant could mean that adjustments negatively affected conversion or average order value.
- A similar revenue across variants may indicate that the tested changes have little impact on user spending behavior.