Average session duration
Understand how each variant in your experiment affects user session duration.
The SDK automatically tracks the events that feed this widget.
This widget shows how long users stay engaged with your application when exposed to different experiment variants. It helps you understand how each variant impacts session duration and whether changes introduced by the experiment encourage deeper engagement or lead users to disengage sooner.
Metrics
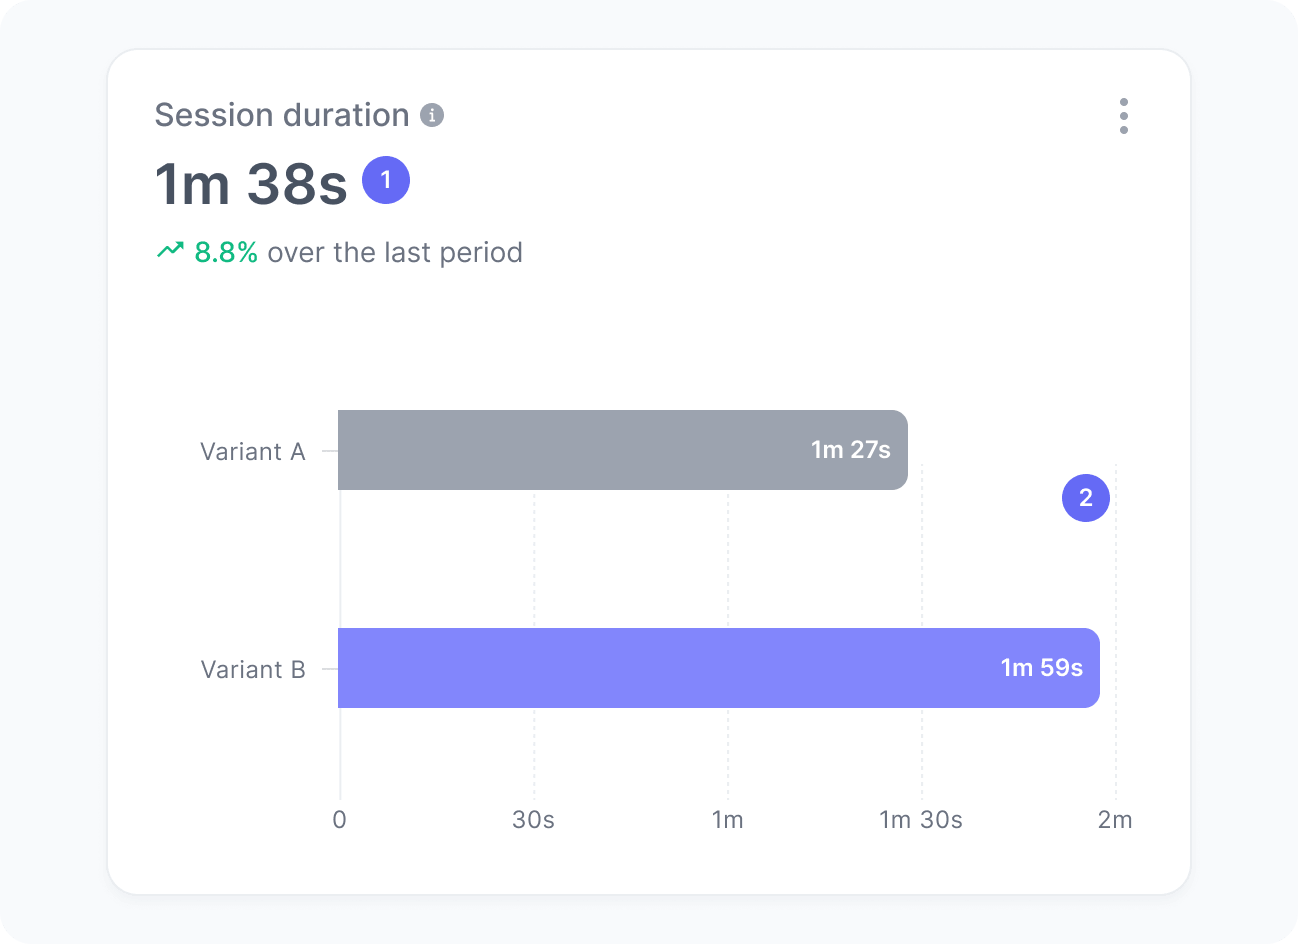
The chart includes:
- Average session duration
The average duration of sessions for users in your experiment. - Session duration per variant
The average duration of sessions for users exposed to each experiment variant.
Interpretation
Differences in session duration help you understand how changes in copy, layout, messaging, or interaction design affect user behavior. A variant that increases session duration may be encouraging exploration, clarity, or relevance. On the other hand, a decrease in duration can indicate added friction, distraction, or misalignment with user intent. However, longer sessions are not always better; they may indicate confusion or difficulty completing tasks.
We calculate this metric using the formula:
What the number tells you
Here are some common insights you can get from this widget:
- A given variant with a higher average session duration often indicates stronger engagement or clearer communication of value.
- A variant that significantly reduces session duration may be interrupting user flow or failing to meet expectations.
- Session duration becomes more meaningful when analyzed together with conversion metrics, helping you distinguish between variants that are efficient versus those that are merely time-consuming.