Order conversion rate
Measure the percentage of sessions in each variant that resulted in a purchase.
Tracking required
Track the Order placed event to feed data into this widget.
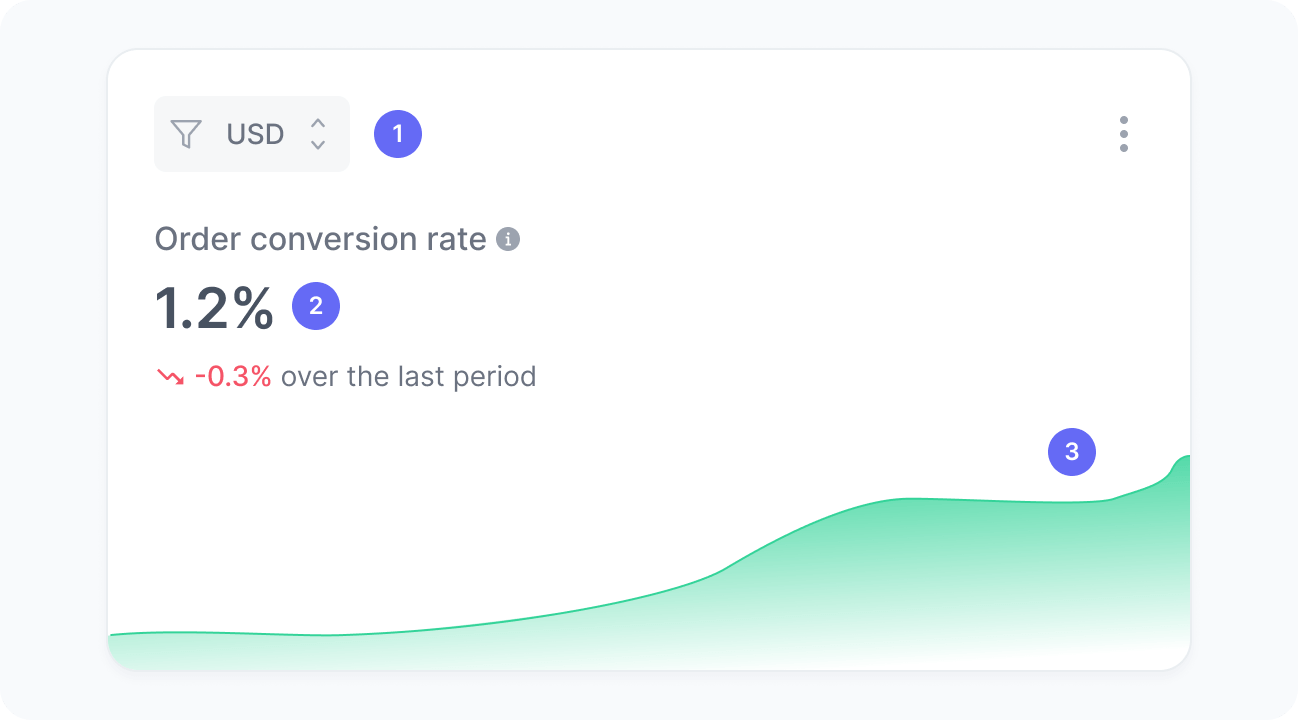
This chart displays the percentage of sessions that resulted in an order among users exposed to each variant in your experiment.
Isolating sessions by variant helps you compare how different versions of an experience influence purchase behavior.
Metrics
The chart includes:
- Currency
A filter to select orders in a specific currency. Values are never aggregated across currencies. - Order conversion rate
The percentage of sessions in each variant that resulted in an order. - Order conversion rate over time
A trend chart showing how the conversion rate evolved over time.
Interpretation
Imagine that, during the selected period, the variant A had 2,000 sessions in total. Out of those, users from 100 sessions placed an order. This means the variant A order conversion rate is 100 divided by 2,000, which results in 5%.
We calculate this metric using the formula:
What the number tells you
Here are some common insights you can get from this widget:
- A higher conversion rate for a given variant suggests that its layout, messaging, or offer is more effective at motivating users to complete a purchase.
- Small differences between variants may indicate that the tested changes have a limited impact or that more data is needed before drawing conclusions.
- A declining conversion rate across all variants can point to external factors or friction in the purchase flow that affect the experiment as a whole.