Sessions per variant
Measure how many sessions each experiment variant generates.
Automatically tracked
The SDK automatically tracks the events that feed this widget.
This widget shows how many sessions (or visits) were assigned to each variant during your experiment.
It helps you confirm that traffic is being distributed according to the allocation settings you defined when creating the experiment.
Metrics
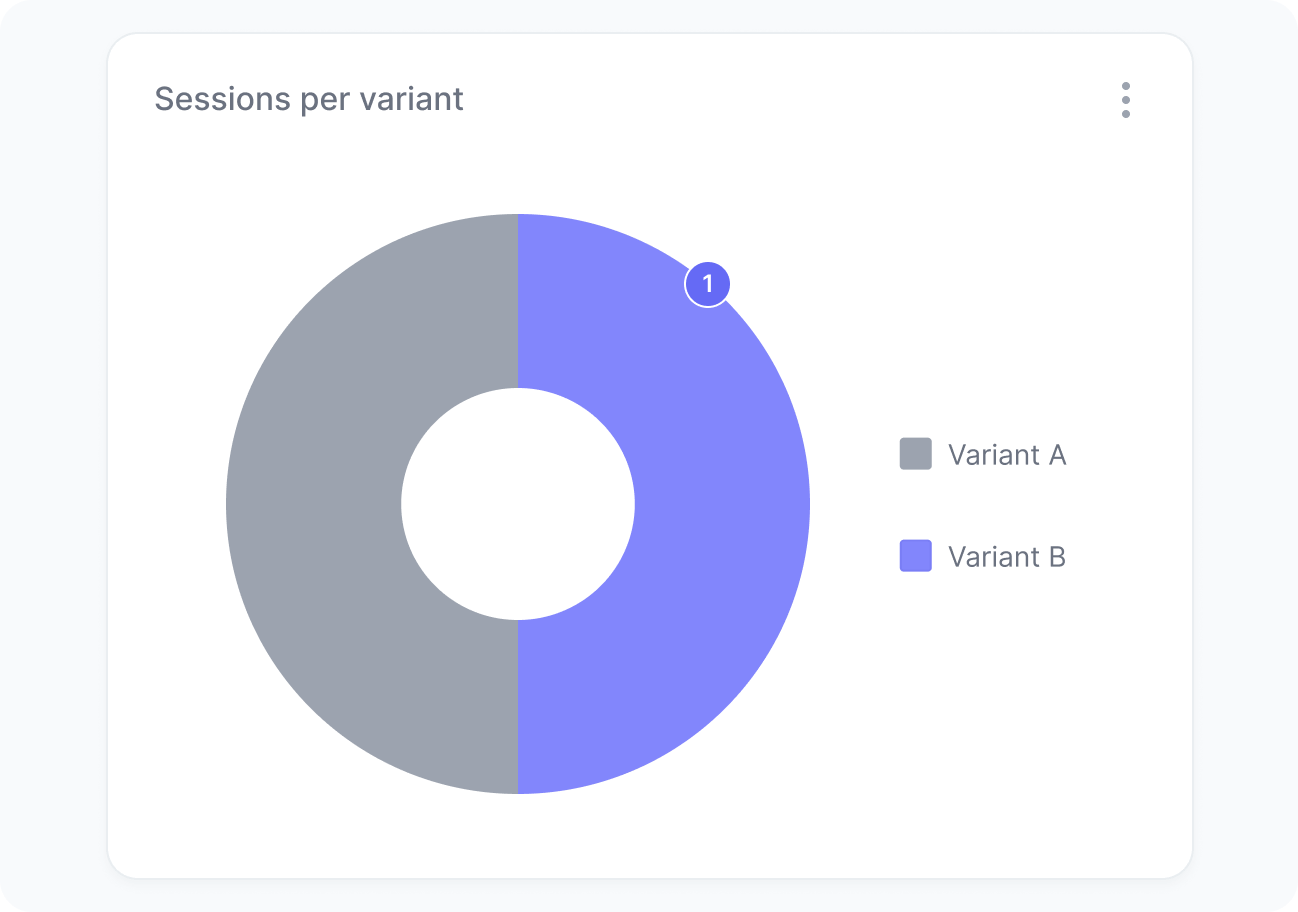
The chart includes:
- Sessions per variant
How many visits were impacted by each variant of your experiment.
Interpretation
This chart helps you evaluate how much exposure your experiment is receiving and how it evolves over time.
It’s normal for the distribution to not match your allocation settings exactly at first. As more sessions are collected, the distribution will converge toward your expected split.
What the number tells you
Here are some common insights you can get from this widget:
- Distribution not matching your settings may indicate a configuration issue or simply that more data is needed. Check your allocation settings if the imbalance persists over time.
- Low session volume overall indicates limited reach. You may need to broaden your audience or reduce the number of variants to collect enough data.