Sign-up conversion rate
Understand how effectively each variant converts visitors into new accounts.
Tracking required
Track the User signed up event to feed data into this widget.
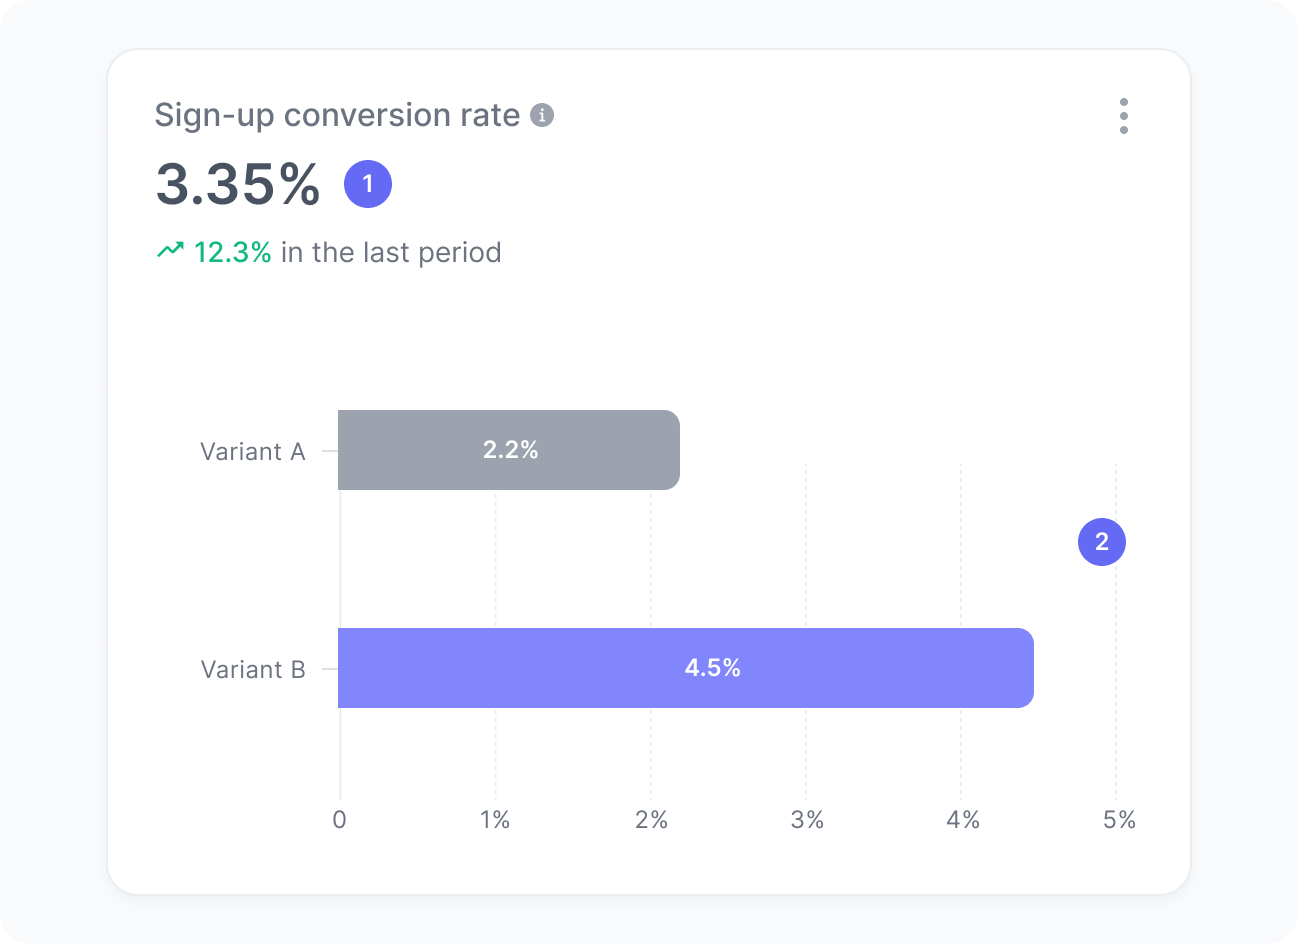
This chart shows the sign-up rate for each variant in your experiment. By including only sessions where users were exposed to a variant, it isolates the effect of your changes and reveals which version drives more account creations.
Metrics
The chart includes:
- Sign-up conversion rate
The percentage of sessions impacted by your experiment that generated a sign-up. - Sign-up conversion rate per variant
The percentage of sessions that resulted in a sign-up by each variant in your experiment.
Interpretation
Imagine your experiment reached 1,200 sessions during the experiment. Out of those, users in 36 sessions completed the sign-up process. This means your sign-up conversion rate is 36 divided by 1,200, resulting in a 3% conversion rate.
We calculate this metric using the formula:
What the number tells you
Here are some common insights you can get from this widget:
- An increasing conversion rate for a given variant indicates that the version shown to users is clearer, more compelling, or reduces friction in the registration process.
- A decreasing or consistently lower conversion rate for a given variant may reveal issues such as unclear messaging, a complex form, or barriers that prevent users from completing sign-up.
- A stable sign-up conversion rate across variants shows that while the user experience changes, user behavior remains consistent.