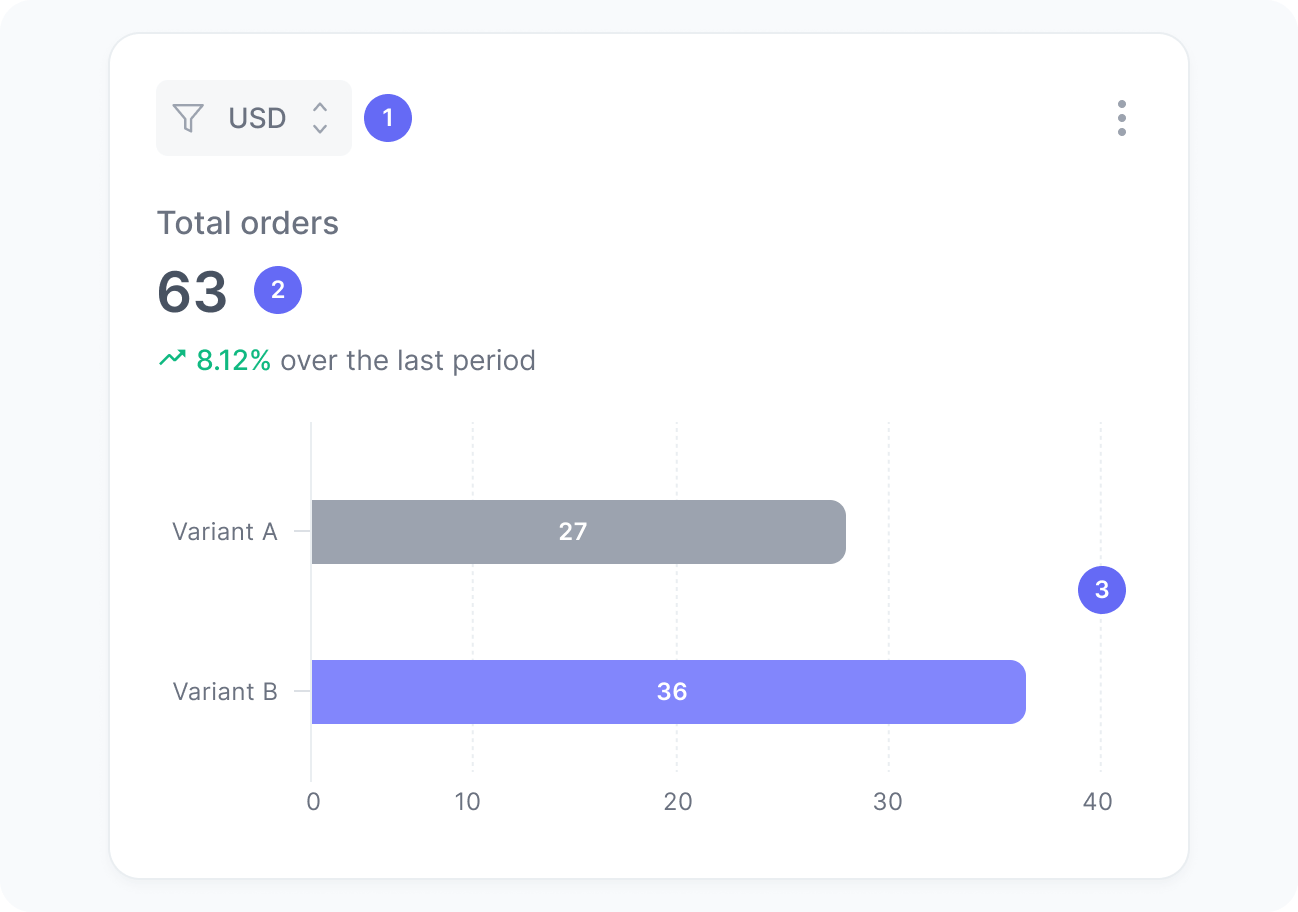
Total orders
Measure the impact of your experiment on order volume.
Track the Order placed event to feed data into this widget.
This chart shows the total number of orders placed, broken down by each variant of your experiment. It helps you evaluate how effectively each version of your experiment drives purchases and contributes to overall sales performance.
By comparing order volume across variants, you can determine which version of your experiment better motivates users to complete transactions, offering valuable insights into user behavior and conversion effectiveness.
Metrics
The chart includes:
- Currency
A filter to select orders in a specific currency. Values are never aggregated across currencies. - Total orders
The number of orders placed during your experiment. - Orders per variant
A breakdown of how many orders were placed in each experiment variant.
Interpretation
This chart shows how many orders each variant generated, helping you identify which version is more effective at converting users into buyers. Keep in mind that large differences may not be meaningful until the experiment reaches statistical validity, especially with low traffic.
What the number tells you
Here are some common insights you can get from this widget:
- Higher orders for a given variant suggest that the tested changes in this variant are positively impacting user purchase behavior.
- A lower-order volume for a given variant can signal usability issues, weaker messaging, or less effective incentives.
- Similar order counts across variants may indicate that the differences between versions are too subtle to influence decisions.
- Sudden spikes or drops in orders might be linked to external factors, such as campaigns, traffic changes, or seasonal trends affecting the experiment.