Average ticket
Measure the average transaction value across your experiment.
Track the Order placed event to feed data into this widget.
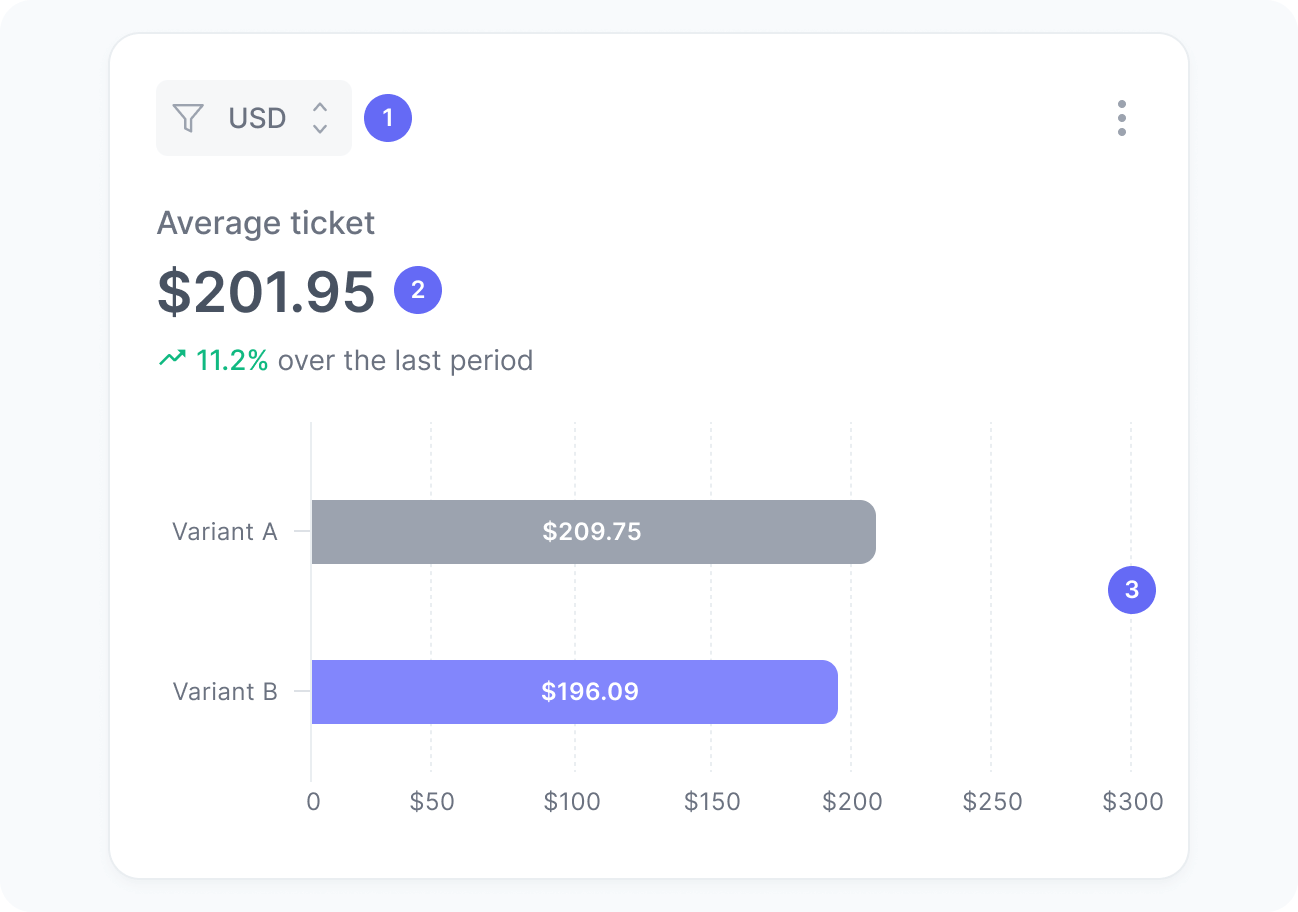
This chart shows the average transaction value during your experiment, broken down by variant. It helps you understand how much, on average, users are spending per order and how each experiment version influences purchasing behavior.
By comparing the average ticket across variants, you can identify which version encourages users to buy higher-value products or larger quantities, providing insight into the impact of your hypothesis on purchase value.
Metrics
The chart includes:
- Currency
A filter to select orders in a specific currency. Values are never aggregated across currencies. - Average ticket
The average order value of your experiment. - Average ticket per variant
A breakdown showing how much users spent per order for each experiment variant.
Interpretation
This widget helps you evaluate how each variant affects the average amount spent per transaction.
For example, if Variant A shows an average ticket of $120 and Variant B shows $95, this suggests that users exposed to Variant A tend to spend more per transaction. This could indicate a more effective upsell strategy, stronger perceived value, or better product presentation.
We calculate this metric using the formula:
What the number tells you
Here are some common insights you can get from this widget:
- A higher average ticket for one variant indicates that this version successfully encourages users to spend more by improving product placement, targeting offers, or messaging, for example.
- A lower average ticket for one variant may suggest that users are opting for lower-priced products or smaller carts in this version, which could reflect discount effects or weaker perceived value.
- A stable average ticket across variants indicates that the experiment has little effect on purchase value, even as order volume varies.