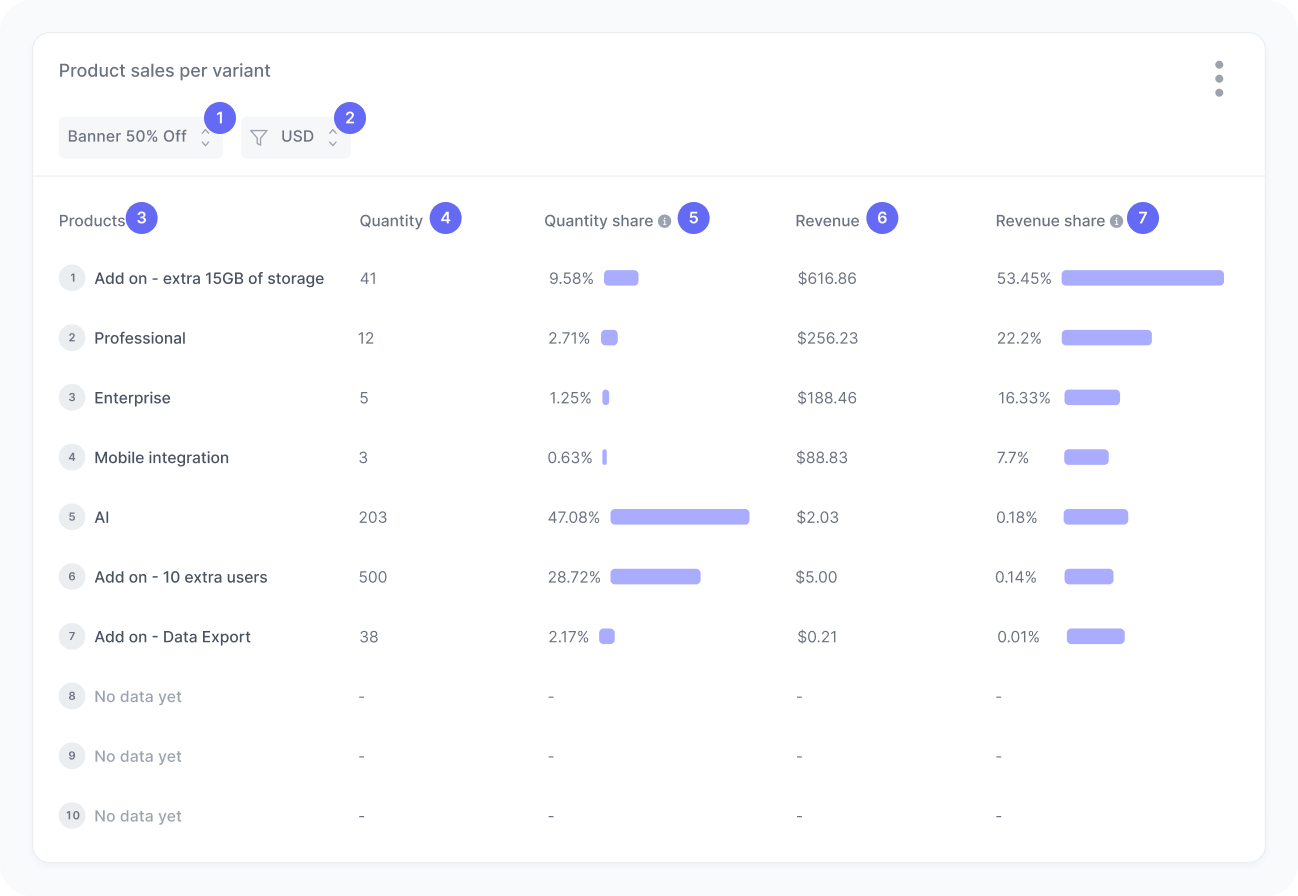
Product sales per variant
Measure sales of top-selling products across experiment variants.
Track the Order placed event to feed data into this widget.
This widget displays the top 10 products for each variant of your experiment. It helps you understand how different variations influence which products generate the most interest and revenue among users.
By comparing product performance across variants, you can uncover how each variation impacts user purchase behavior and product interest. This makes it easier to connect what is being tested in the experiment with what actually drives sales, giving you insights into both performance and alignment between content and demand.
Metrics
The chart includes:
- Variant filter
A filter to select orders of a specific variant. - Currency
A filter to select orders in a specific currency. - Product
The name or identifier of the product. - Quantity
The total number of units sold. - Quantity share
The percentage of all units sold that this product represents. - Revenue
The total revenue generated by the product. - Revenue share
The percentage of total revenue that comes from this product.
Interpretation
This widget helps you analyze how product performance differs across variants in your experiment. Imagine Variant A generated sales of 200 products in total, 30 of which were white T-shirts. This means 30 white T-shirts were sold in Variant A, making up 15% of all units sold for that version.
We calculate this metric using the formula:
Now consider revenue. If those 200 products together brought in $6,000, and each white T-shirt was priced at $25, then the white T-shirts accounted for $750 in sales. That corresponds to 12.5% of the total revenue for Variant A.
We calculate this metric using the formula:
What the number tells you
Here are some common insights you can get from this widget:
- Differences in product rankings across variants reveal which version better highlights or motivates users to buy a given product.
- If a promoted or featured product appears among the top performers in one variant, it may indicate that this variant’s changes positively influenced its sales.
- If expected products don’t perform well across variants, it may suggest weak user interest or a need to adjust targeting, pricing, or messaging.