Filters
Learn how to use filters in the experiment dashboard.
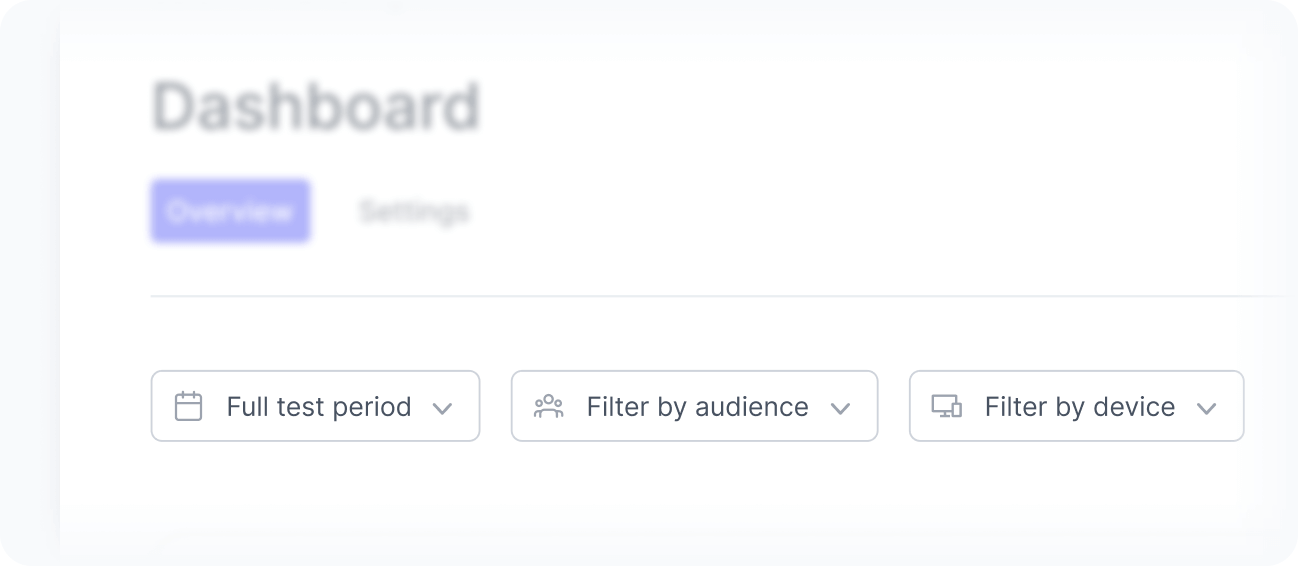
Filters help you analyze experiment results from different perspectives and better understand how each variant performs over time, across audiences, and across devices.
By applying filters, which affect all widgets, you can isolate specific scenarios and gain more precise insights into your test outcomes.
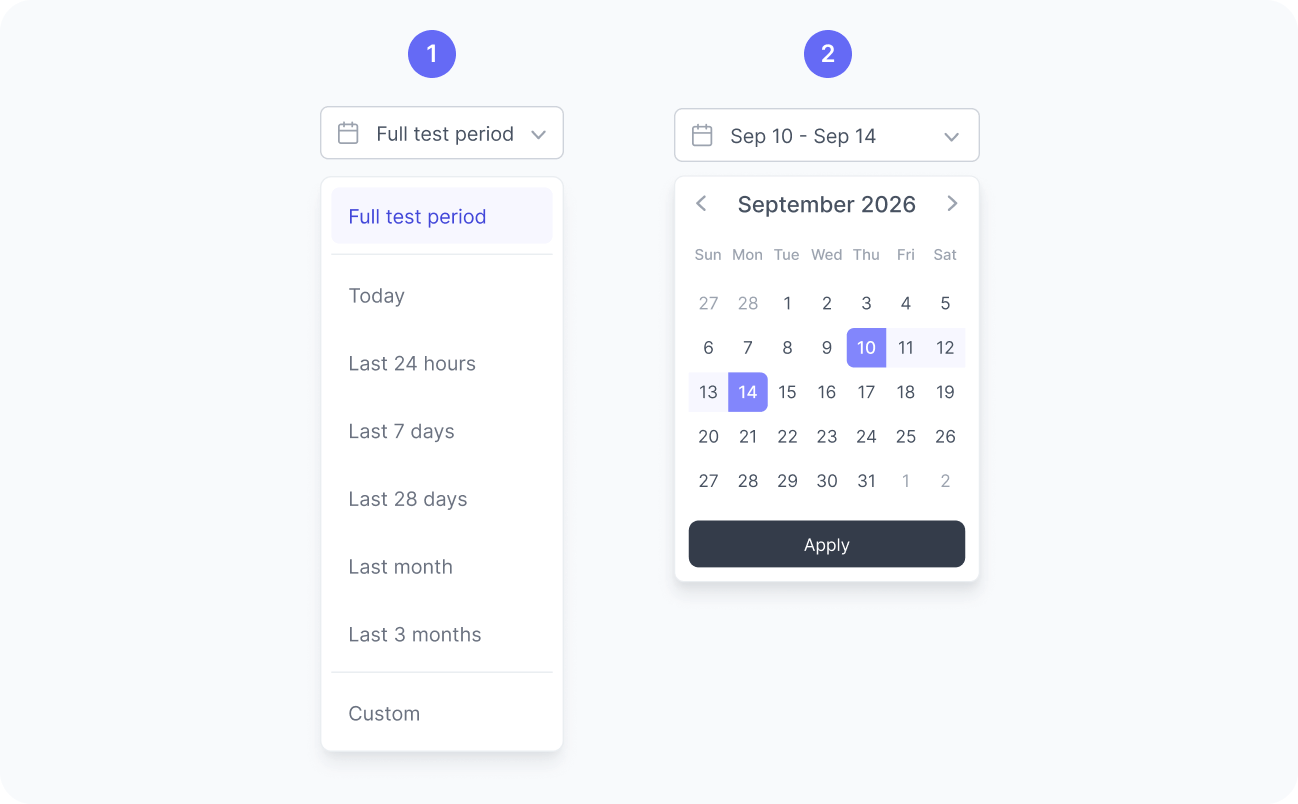
Date filter
By default, the dashboard displays data from the full test period, but you can also choose from other predefined ranges, such as today, last 14 days, or last 28 days, or define a custom date range like September 10 to 14.
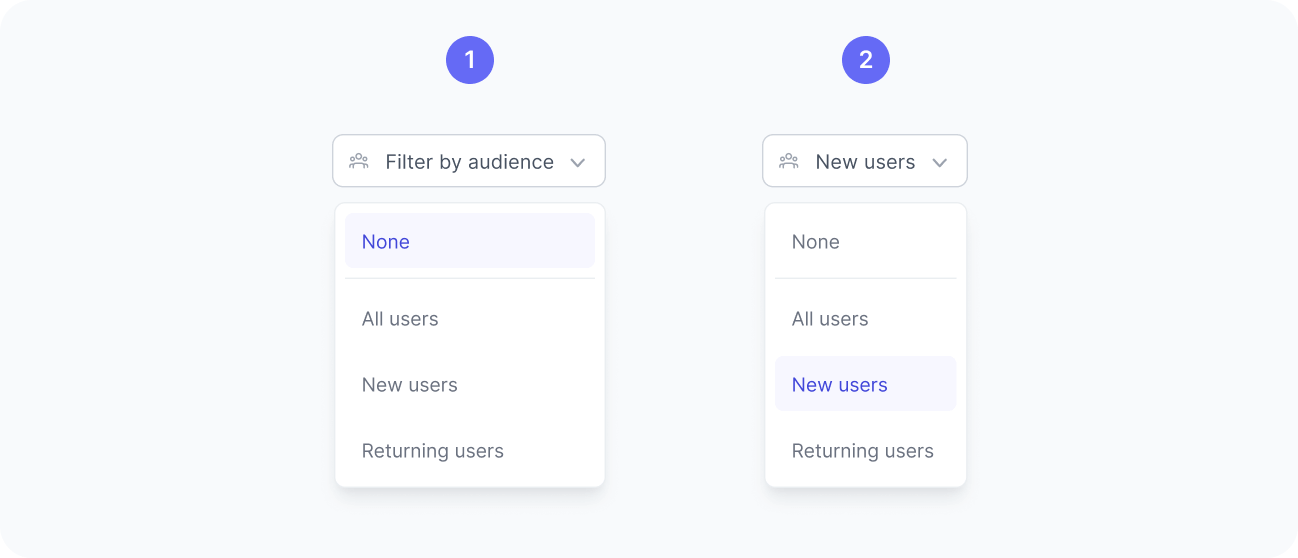
Audience filter
By default, the audience filter includes all audiences in the experiment that received traffic. You can narrow your analysis by selecting a specific audience from the list.
Once applied, the dashboard updates to display data only from users who matched the selected audience and participated in the experiment. This makes it easier to evaluate how different segments respond to each variant and identify audience-specific performance patterns.
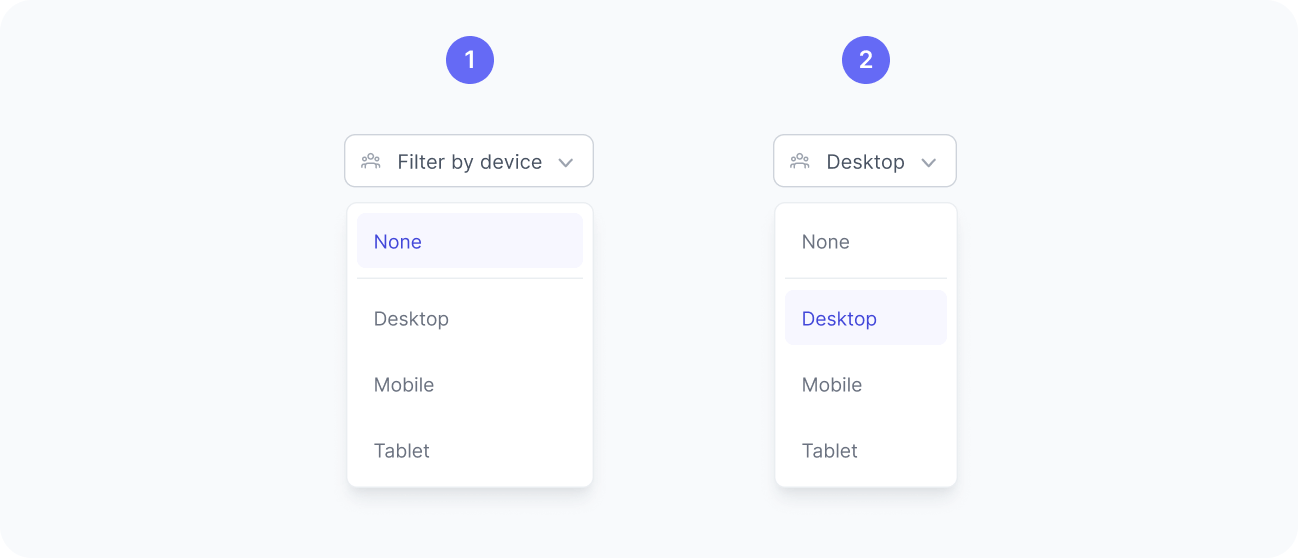
Device filter
By default, the device filter is set to all devices. You can narrow the analysis by selecting a specific device type, such as mobile, desktop, or tablet.
When you apply a device filter, the dashboard updates to show data only from experiment sessions on the selected device. This helps you understand how device context influences experiment results and whether certain variants perform better on specific devices.