Total sign-ups
Understand how many new accounts your experiment generated.
Track the User signed up event to feed data into this widget.
This chart shows how many sign-ups were generated by users who participated in your experiment.
We count a sign-up every time your application sends a sign-up event, usually when a user creates a new account.
Because this widget breaks results down by variant, it helps you understand how each version of your content, layout, incentive, or message influences account creation behavior.
Metrics
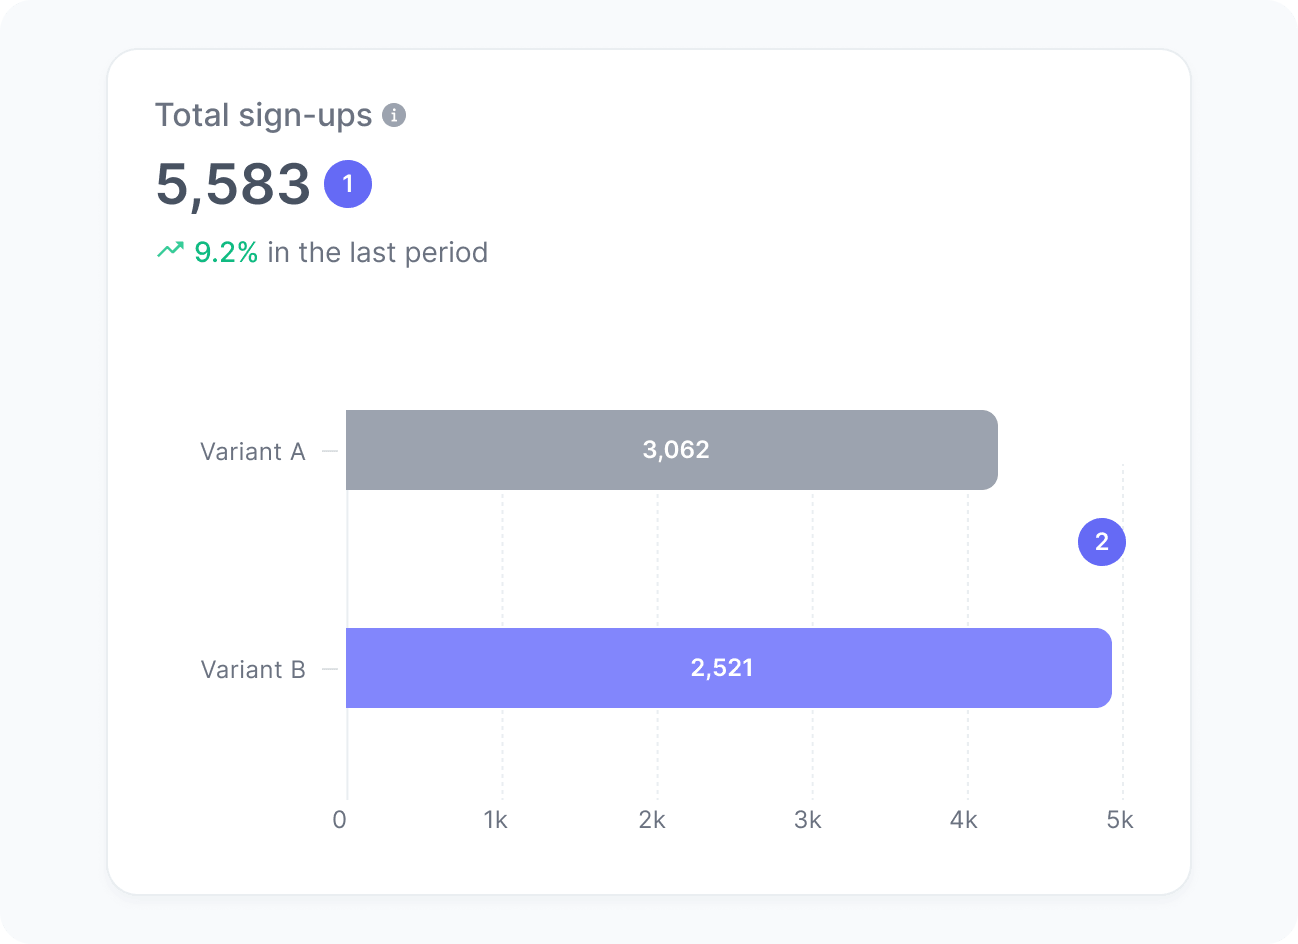
The chart includes:
- Total sign-ups
The number of sign-ups generated during your experiment. - Sign-ups per variant
The number of sign-ups generated by users who were impacted by each variant in your experiment.
Interpretation
This chart helps you understand how many new accounts your experiment is generating and how each variant contributes to this outcome.
For example, if Variant C introduces social proof or reduces the number of required fields, you can track whether total sign-ups increased among users assigned to that variant.
What the number tells you
Here are some common insights you can get from this widget:
- A rising sign-up count for a given variant suggests that its experience resonates more strongly with users and encourages more of them to create an account.
- A decline or consistently low count for a given variant may indicate friction in the sign-up process, lack of clarity in the value proposition, or a mismatch between content and user intent.
- Similar sign-up counts across variants may indicate that the differences between versions are too subtle to influence decisions.
- Sudden spikes or drops in sign-ups might be linked to external factors, such as campaigns, traffic changes, or seasonal trends affecting the experiment.