Lead conversion rate
Understand how effectively each variant converts visitors into leads.
Track the Lead generated event to feed data into this widget.
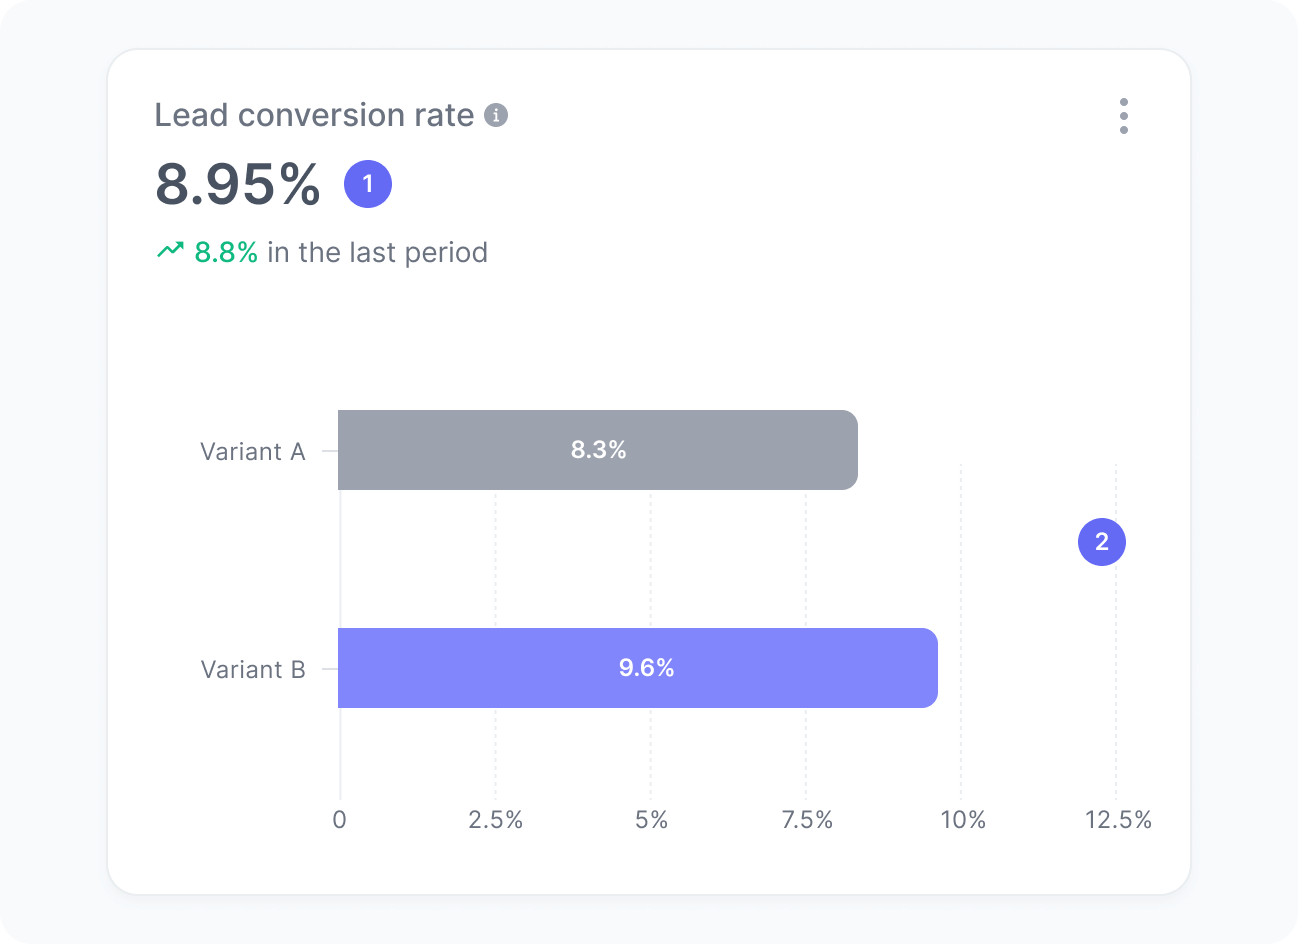
This chart displays the percentage of sessions that became leads among users impacted by each variant in your experiment.
Unlike sitewide conversion metrics, this widget isolates the impact of the variations you are testing, giving you a clear signal of which version performs better at motivating users to submit a form or complete another lead-generating action.
Metrics
The chart includes:
- Lead conversion rate
The percentage of sessions impacted by your experiment that generated a lead. - Lead conversion rate per variant
The percentage of sessions that resulted in a lead by each variant in your experiment.
Interpretation
Imagine that one variant of your experiment reached 1000 sessions during it. Out of those, users in 150 sessions submitted a form or completed another lead-generating action. This means your lead conversion rate is 150 divided by 1000, resulting in a 15% conversion rate.
We calculate this metric using the formula:
What the number tells you
Here are some common insights you can get from this widget:
- An increasing conversion rate for a given variant suggests that its content, message, or UX approach is more aligned with the user’s intent and is more effective at driving lead actions.
- A decreasing or consistently lower conversion rate may indicate friction or a mismatch in that variant, suggesting an opportunity to refine the idea or explore alternative hypotheses.
- A stable lead conversion rate across variants shows that while the user experience changes, user behavior remains consistent.