Sessions with click
Understand how each variant in your experiment impacts user interactions through clicks.
The SDK automatically tracks the events that feed this widget.
This widget shows how users interact with your content when exposed to different experiment variants. It measures the percentage of sessions with clicks and the average number of clicks per session, allowing you to compare how each variant influences user interaction.
Click metrics help you evaluate how changes in layout, messaging, or interface elements influence engagement. Comparing these metrics across variants can reveal which version encourages users to explore the interface and available actions.
Metrics
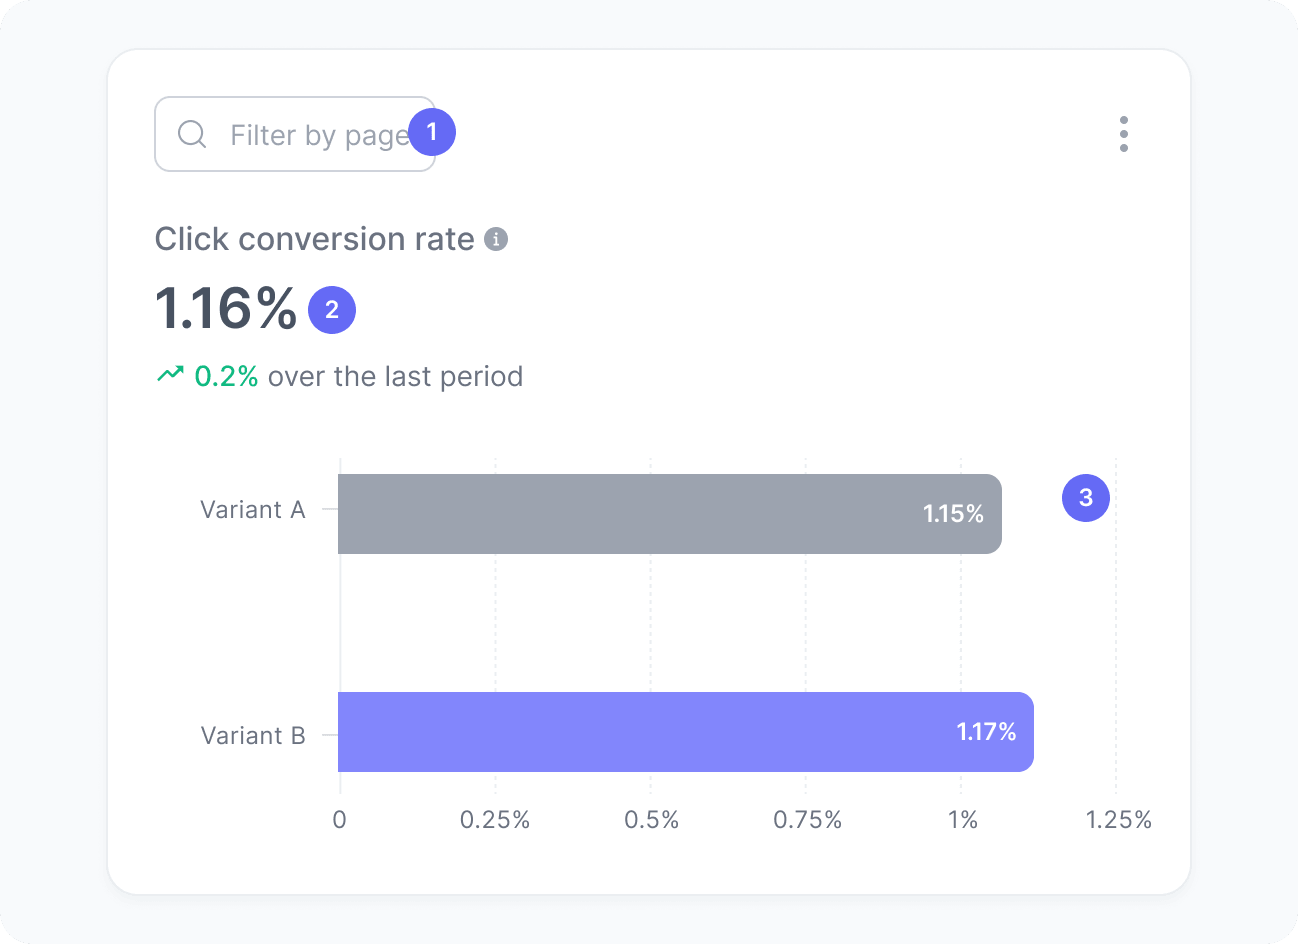
The chart includes:
- Page filter
A filter to optionally select the page you want to analyze. - Click conversion rate
The percentage of sessions with at least one click for users participating in your experiment. - Average clicks per session
The average number of clicks performed during sessions in your experiment. - Clicks by variant
The interaction metrics for users exposed to each experiment variant.
Interpretation
Imagine your experiment generated 1,000 sessions in total, split evenly between two variants. If 32 of the 500 sessions in Variant A included at least one click, that means 6.4% of the sessions exposed to this variant generated this type of interaction.
We calculate this metric using the formula:
Now consider the number of clicks generated by those sessions. If users exposed to Variant A generated 120 clicks across the 500 sessions, this results in an average of 0.24 clicks per session for that variant.
We calculate this metric using the formula:
What the number tells you
Here are some common insights you can get from this widget:
- Clicks become more meaningful when analyzed together with conversion and other engagement metrics, helping you understand whether user interactions are leading to meaningful outcomes.
- A variant with a higher percentage of sessions with clicks may be making interactive elements clearer, more compelling, or more relevant for users.
- A variant with fewer interactions may be reducing visibility of actions or creating confusion about where to click.
- Average clicks per session provide additional context. Higher interaction may indicate stronger engagement, but extremely high click counts can also signal friction if users are struggling to complete tasks.
- Click metrics become more powerful when analyzed together with engagement and conversion metrics, helping you identify which variants encourage meaningful interaction rather than unnecessary clicks.