Total orders
Measure the impact of your experience on order volume.
Tracking required
Track the Order placed event to feed data into this widget.
This chart displays the total number of orders placed within the selected period.
Keeping an eye on order volume helps you detect spikes or drops in performance and understand how your experience is influencing buying behavior. It is a valuable indicator of how effectively your audience is being converted into actual customers.
Metrics
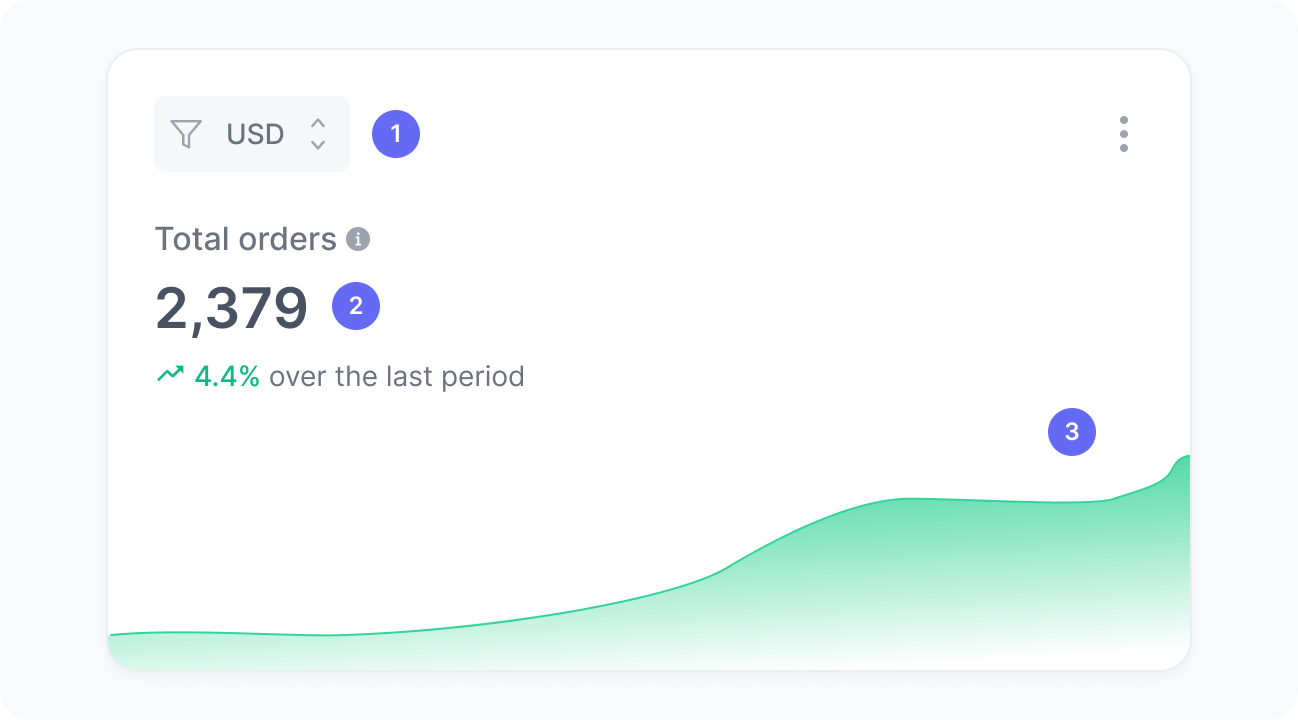
The chart includes:
- Currency
A filter to select orders in a specific currency. Values are never aggregated across currencies. - Total orders
The number of orders placed by users impacted by your experience. - Orders over time
A trend chart showing the number of orders over time.
Interpretation
This chart helps you understand how your experience affects order volume. For example, if you launched a personalized experience, you can assess whether it led to an increase in orders.
What the number tells you
Here are some common insights you can get from this widget:
- An upward trend in orders after launching the experience, such as a rise from 100 to 150 orders per day, suggests the experience is driving more purchases. Analyze which elements of the experience contributed to this increase to optimize further.
- Stable order volume, such as consistently around 100 orders per day despite increased traffic, may indicate the experience isn’t significantly influencing conversions. Consider evaluating other goals, like engagement, or testing adjustments to boost impact.
- A decline in orders, for example, from 100 to 70 orders per day after a content or design change, could signal that the update is deterring purchases. Investigate potential issues, such as messaging or usability, and experiment with revisions.
- When filtered by audience, the chart highlights which segments drive the most orders, enabling you to refine targeting strategies for better results.