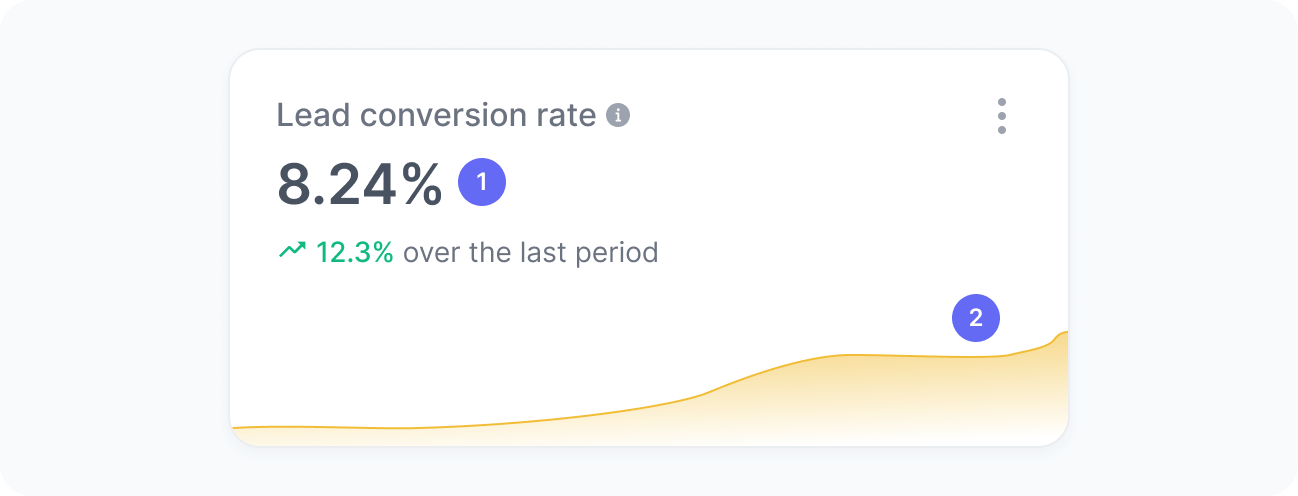
Lead conversion rate
Understand how effectively your experience converts visitors into leads.
Track the Lead generated event to feed data into this widget.
This chart displays the percentage of sessions in which users became leads during the selected period.
Instead of measuring conversion across the entire application, this widget isolates the impact of your experience on lead performance, giving you a clear, direct signal of its effectiveness. This helps you assess whether your personalized content, messaging, or interaction model is successfully motivating users to submit a form or complete another lead-generating action.
Metrics
The chart includes:
- Lead conversion rate
The percentage of sessions impacted by the experience that generated a lead. - Lead conversion rate over time
A trend chart showing how the conversion rate evolved over time.
Interpretation
Imagine that your experience reached 800 sessions during the selected period. Out of those, users in 24 sessions submitted a form or completed another lead-generating action. This means your lead conversion rate is 24 divided by 800, resulting in a 3% conversion rate.
We calculate this metric using the formula:
What the number tells you
Here are some common insights you can get from this widget:
- An increasing conversion rate suggests that your experience is relevant, persuasive, and aligned with the intent of the targeted audience.
- A decrease may signal friction in the content or a mismatch between the message and the audience, and could indicate an opportunity to refine your experience.
- Observing the conversion rate over time helps you understand how content updates, UX changes, or broader strategic initiatives affect lead performance.