Average ticket
Measure the average transaction value of your experience.
Tracking required
Track the Order placed event to feed data into this widget.
The average ticket measures the average value of transactions, providing insights into customer spending behavior and the types of products or services they are purchasing.
Metrics
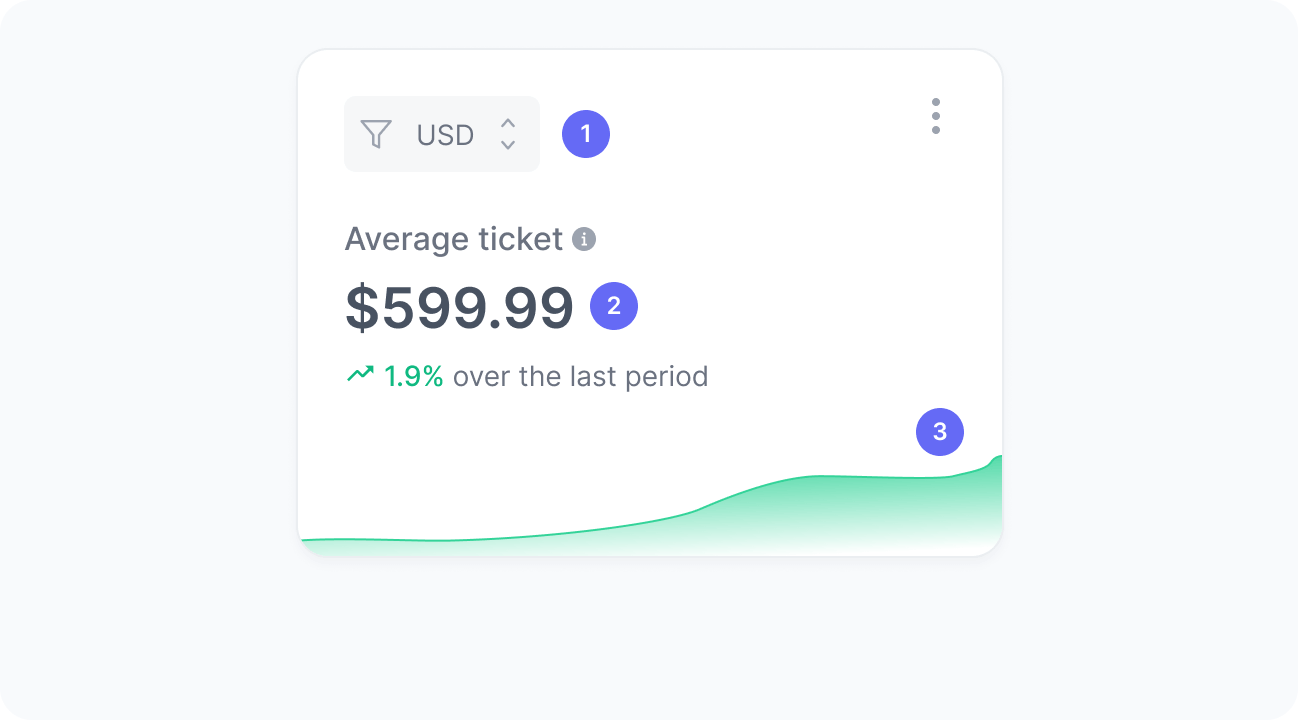
The chart includes:
- Currency
A filter to select orders in a specific currency. Values are never aggregated across currencies. - Average ticket
The average order value within the selected period. - Average ticket over time
A trend chart showing the average order value over time.
Interpretation
Imagine your experience generated a total revenue of $3,000 from 50 orders. To calculate the average ticket, we divide the total revenue by the number of orders, which results in $60.
We calculate this metric using the formula:
What those numbers tell you
Here are some common insights you can get from this widget:
- A higher average ticket suggests that users are spending more per order. This often means your pricing, bundling, or upselling strategies are working effectively.
- A lower average ticket indicates smaller order values, which might signal missed opportunities for cross-selling, upselling, or optimizing pricing.
- Tracking this metric over time reveals whether changes in your experience are encouraging customers to add more items, choose higher-value options, or if they are trending toward smaller purchases.