Conversions
Measure the performance of your experience against key goals.
Track the Goal completed event to feed data into this widget.
This widget shows the total number of conversions for a specific goal, such as sign up, CTA click, or newsletter subscription. It also gives the conversion rate, which is the percentage of sessions in which users completed a given goal.
Besides these metrics, you will find a breakdown to help you identify how the user behavior varies across different devices, like mobile, desktop, and tablet.
Conversion metrics are among the most important indicators for evaluating the impact of an experience since they reveal how it influences user behavior and decision-making throughout the journey. By analyzing this data, you gain valuable insights into what drives results and where to focus optimization efforts.
Metrics
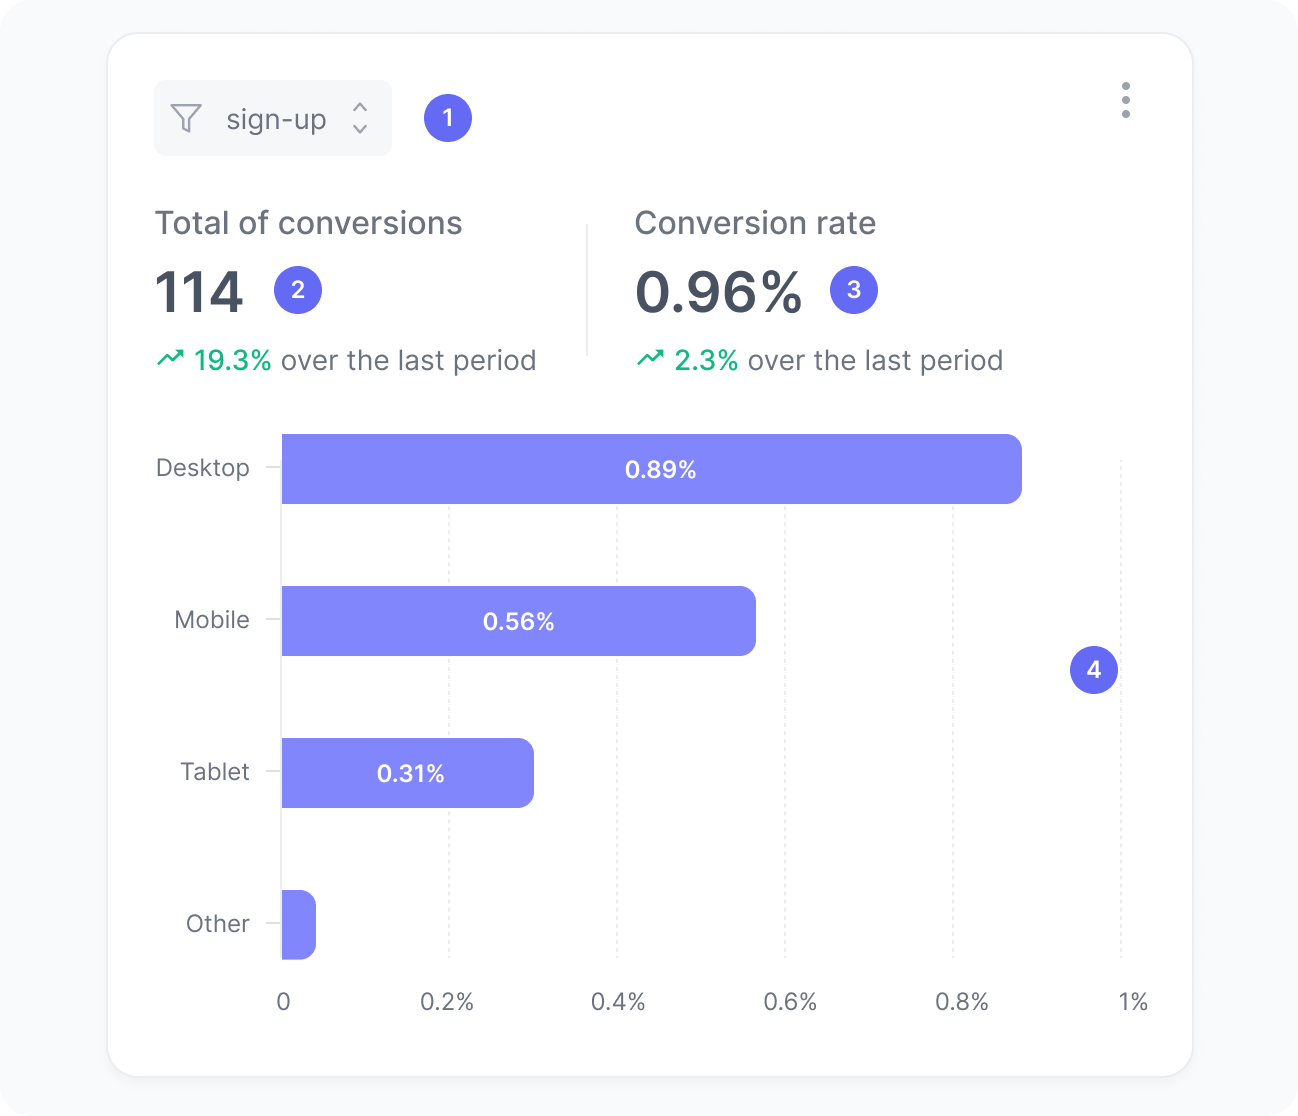
The chart includes:
- Goal filter
A filter to select the goal you want to analyze. - Total of conversions
The number of sessions in which the selected goal was completed. - Conversion rate
The percentage of sessions in which the selected goal was completed. - Conversion rate by device:
Breaks down the percentage of sessions in which the selected goal was completed by the user’s device type.
Interpretation
Imagine your experience had 40 sessions in total. Out of those, the goal cta-click was completed in 10 sessions. This means that your conversion rate is 10 divided by 40, which results in 25%.
We calculate this metric using the formula:
What the number tells you
Here are some common insights you can get from this widget:
- A higher conversion rate signals that your experience is effectively motivating users to take the desired action.
- A lower conversion rate may indicate friction, poor visibility, or lack of relevance.
- Device breakdowns highlight whether certain channels perform better, guiding optimization for specific user contexts.
- These insights help you identify where improvements can have the greatest impact.