Order conversion rate
Measure the percentage of experience sessions that ended in a purchase.
Track the Order placed event to feed data into this widget.
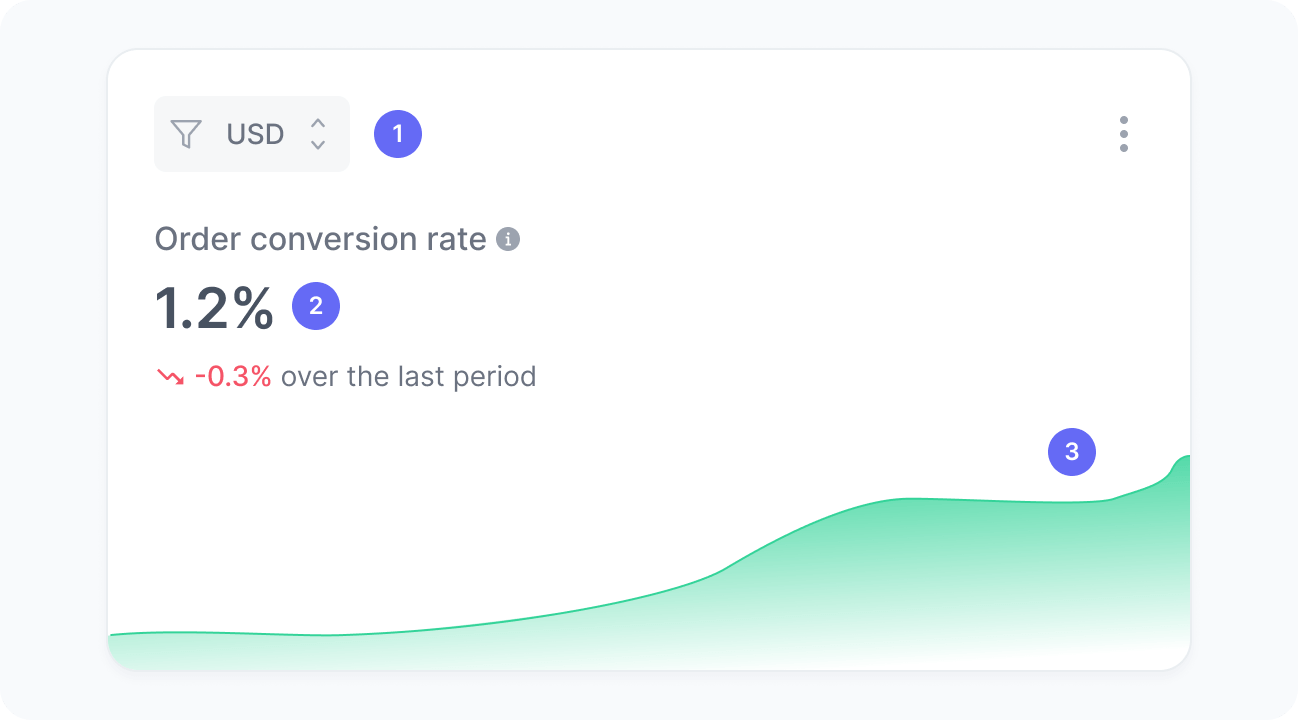
This chart displays the percentage of sessions that resulted in an order among users who viewed the experience during the selected period.
Monitoring this metric over time helps you understand whether your personalized content, messaging, or journey design is influencing purchase behavior.
Metrics
The chart includes:
- Currency
A filter to select orders in a specific currency. Values are never aggregated across currencies. - Order conversion rate
The percentage of sessions impacted by the experience that resulted in an order. - Order conversion rate over time
A trend chart showing how the conversion rate evolved over time.
Interpretation
Imagine that, during the selected period, your experience reached had 2,000 sessions in total. Out of those, users from 100 sessions placed an order. This means your order conversion rate is 100 divided by 2,000, which results in 5%.
We calculate this metric using the formula:
What the number tells you
Here are some common insights you can get from this widget:
- An increasing order conversion rate suggests that the experience is relevant and persuasive, effectively guiding users toward completing a purchase. This often indicates that the content, layout, or target promotions align well with user intent.
- A decline in conversion rate may signal friction within the experience, such as unclear messaging, misaligned offers, or disruptions in the purchase flow. It can also indicate that the experience is not resonating with the selected audience.
- Observing changes over time helps you understand how updates to your experience, UX adjustments, or broader initiatives influence purchase behavior. This way, you can evaluate the real impact of your experience and identify opportunities for optimization or experimentation.