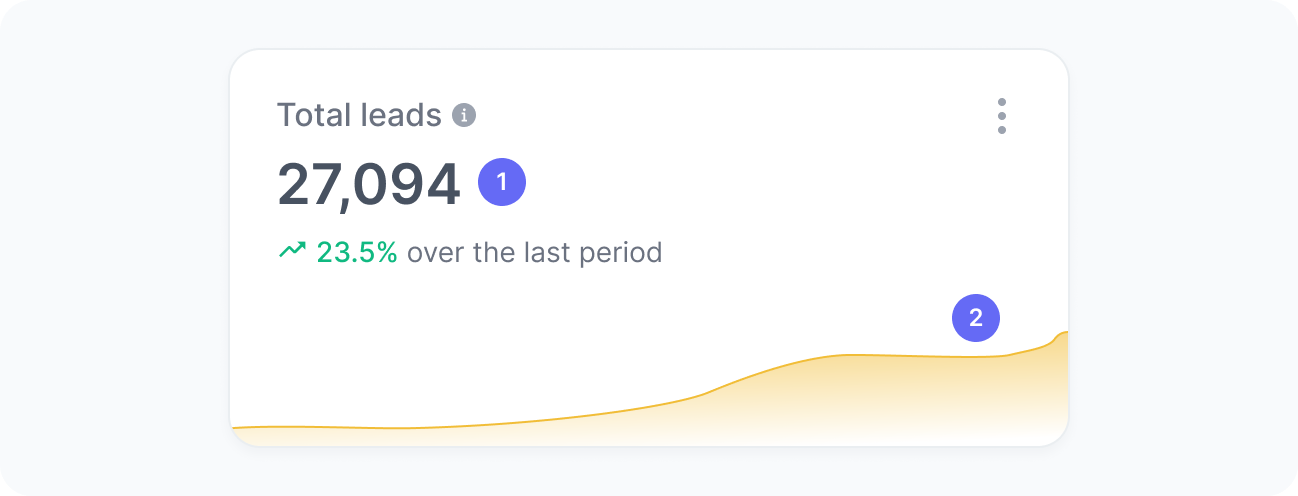
Total leads
Track how many leads your experience generated.
Track the Lead generated event to feed data into this widget.
This chart shows the total number of leads generated among users who viewed the experience during the selected period.
A lead typically refers to a user who has demonstrated an interest in your product or service by performing a particular action, such as filling out a form, requesting a quote, signing up for a newsletter, or registering for a waiting list.
This metric helps you understand how your personalized content or targeted journey is influencing lead generation.
Metrics
The chart includes:
- Total leads
The number of leads generated by users who were impacted by your experience. - Leads over time
A trend chart showing the number of leads over time.
Interpretation
This chart helps you understand how many leads your experience is generating over time. This metric is especially helpful when evaluating whether an experience, such as a tailored message, a new layout, or a personalized CTA, is successfully driving more users to complete key lead-generation actions. For example, after publishing a personalized banner for returning visitors or tailoring a landing page for a specific segment, you can track whether total leads increased among users who saw that experience.
What the number tells you
Here are some common insights you can get from this widget:
- A rising lead count suggests that the experience is influencing user behavior positively and helping more visitors convert.
- A decline may point to issues with the content, audience targeting, or form flow, and may signal an opportunity for optimization or experimentation.
- Monitoring changes over time helps you evaluate the real impact of your personalization efforts on lead generation.