Clicks
Understand how your experience impacts user interactions through clicks.
The SDK automatically tracks the events that feed this widget.
This widget shows how users interact with your content after being exposed to an experience. It measures the percentage of sessions with clicks and the average number of clicks per session, helping you evaluate whether the experience encourages exploration, highlights relevant actions, or unintentionally reduces user interaction.
Besides these metrics, you will find a breakdown to help you identify how user behavior varies across different devices, such as mobile, desktop, and tablet.
Metrics
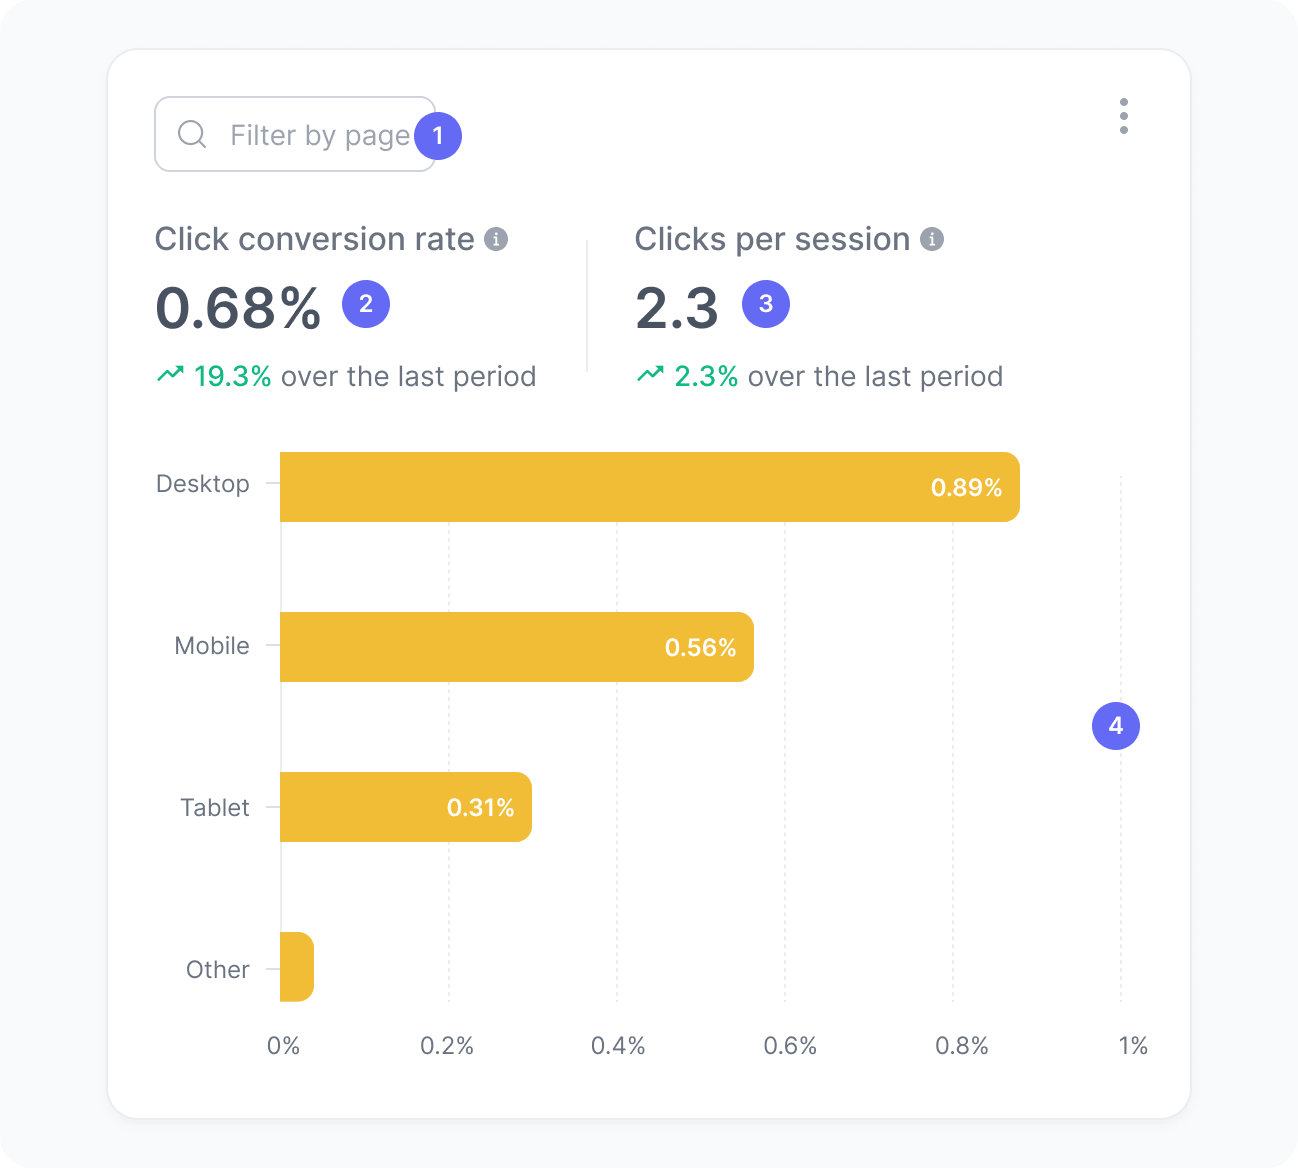
The chart includes:
- Page filter
A filter to optionally select the page you want to analyze. - Sessions with click
The percentage of sessions impacted by your experience that included at least one click. - Average clicks per session
The average number of clicks performed during sessions impacted by your experience. - Clicks by device
A breakdown showing how interaction patterns vary across device types.
Interpretation
Imagine that an experience was shown during 800 sessions, and 52 of those sessions included at least one click. This means that 6.5% of the sessions impacted by the experience generated interaction with the interface.
We calculate this metric using the formula:
Now consider the total number of clicks performed during those sessions. If users generated 160 clicks across the 800 sessions, this means that users performed an average of 0.2 clicks per session while being exposed to the experience.
We calculate this metric using the formula:
What the number tells you
Here are some common insights you can get from this widget:
- An increase in sessions with clicks may indicate that the experience is successfully drawing attention to interactive elements or encouraging users to explore the interface.
- A decrease may suggest that the experience interrupts the interaction flow, hides important actions, or distracts users from key tasks.
- The average clicks per session adds context to this behavior. More clicks may reflect deeper interaction with the experience, but unusually high click counts may also signal friction if users need multiple attempts to complete actions.
- Differences in click behavior across devices may reveal opportunities to improve layout, positioning, or usability for specific screens.
- Clicks become more meaningful when analyzed together with conversion and other engagement metrics, helping you understand whether user interactions are leading to meaningful outcomes.