Order conversion rate
Measure the percentage of sessions that ended in a purchase.
Track the Order placed event to feed data into this widget.
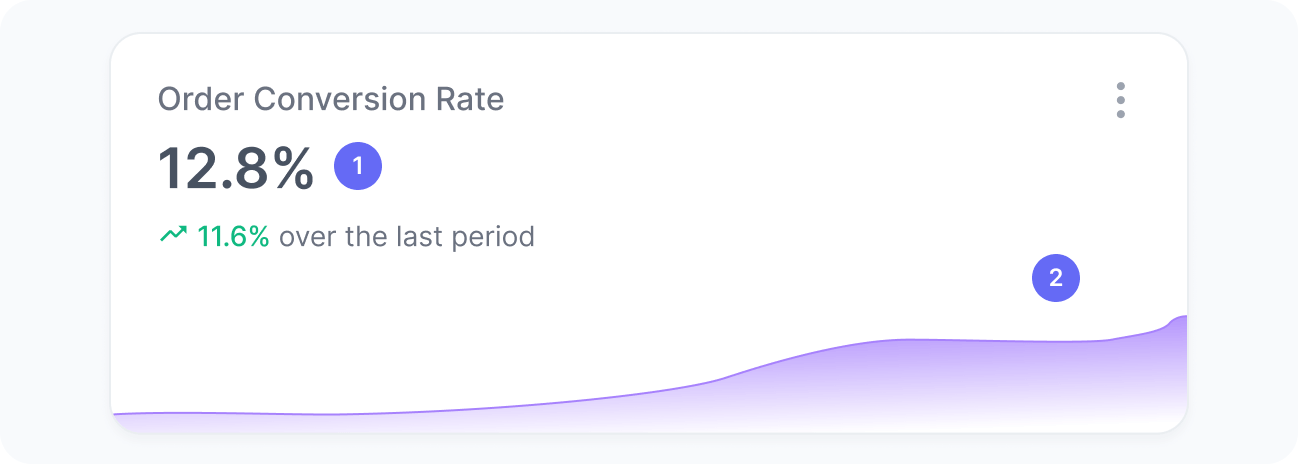
This chart displays the percentage of sessions in which an order was placed during the selected period.
Monitoring this metric over time helps you identify patterns and fluctuations in user purchase behavior. At the workspace level, this rate reflects all orders across your applications, including sessions from users impacted by experiences or experiments and those who weren't.
Metrics
The chart includes:
- Order conversion rate
The percentage of sessions that resulted in an order. - Order conversion rate over time
A trend chart showing how the conversion rate evolved over time.
Interpretation
Imagine that, during the selected period, your website had 2,000 sessions in total. Out of those, users from 100 sessions placed an order. This means your order conversion rate is 100 divided by 2,000, which results in 5%.
We calculate this metric using the formula:
What the number tells you
Here are some common insights you can get from this widget:
- A rise in order conversion rate suggests that recent updates, such as campaigns, content adjustments, or optimizations, are effectively driving more users to complete purchases. Analyze which specific initiatives contributed to this growth to replicate their success.
- If the order conversion rate drops, it could indicate that users are browsing but not converting. This might suggest opportunities to refine targeting or enhance the user journey.
- A sudden decline in this metric may point to friction in the purchase flow, such as checkout issues, unclear messaging, or decreased interest in key products. Review recent changes, including design updates or campaign pauses, to identify potential causes.