Sessions
Compare new and returning traffic.
Automatically tracked
The SDK automatically tracks the events that feed this widget.
This chart shows how the total number of sessions (or visits) of your site is distributed between new users and returning users. It helps you understand the balance between attracting new visitors and retaining existing ones.
Metrics
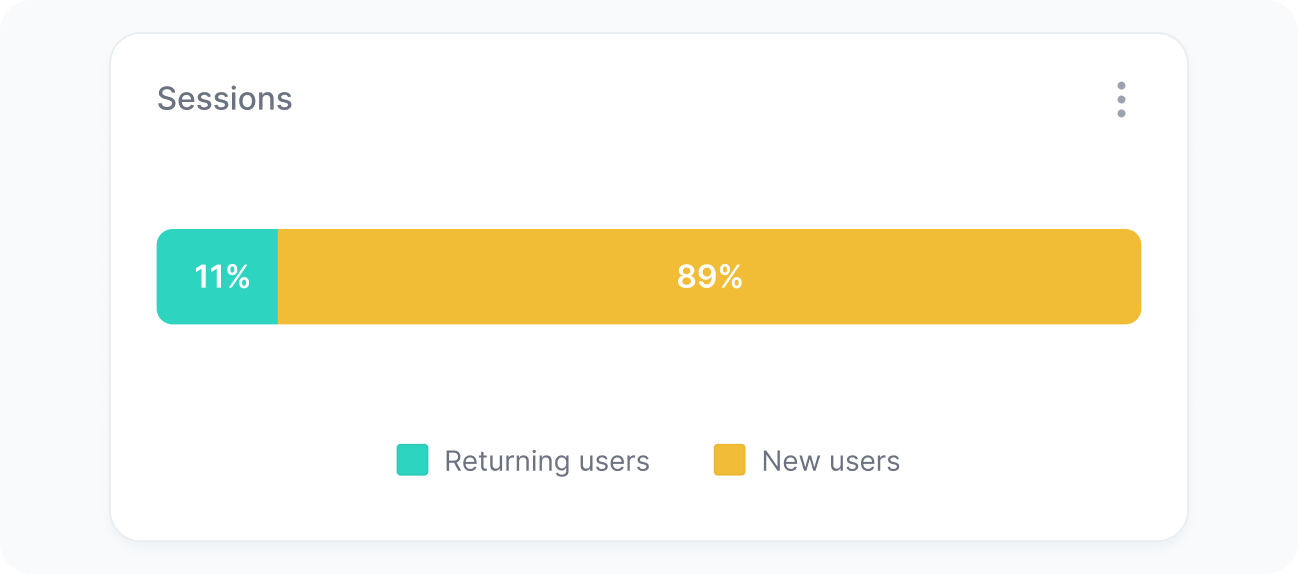
The chart includes:
- Percentage of new users
The percentage of sessions initiated by first-time visitors to your site. - Percentage of returning users
The percentage of sessions from visitors who have accessed your site before.
Interpretation
This chart helps you understand how your audience behaves over time. By analyzing this data, you can assess whether your strategies are driving growth by bringing in new users or building loyalty by encouraging users to return.
What the number tells you
Here are some common insights you can get from this widget:
- If a large share of sessions comes from returning users, it means visitors are coming back to your website, a positive sign of engagement and brand awareness. It suggests that your content, experience, or offering keeps users interested and encourages them to return.
- On the other hand, if new users represent a higher percentage of sessions, it indicates your site is attracting new visitors. This can be a strong indicator of successful acquisition strategies or increased visibility, such as through marketing campaigns, SEO, or referrals.