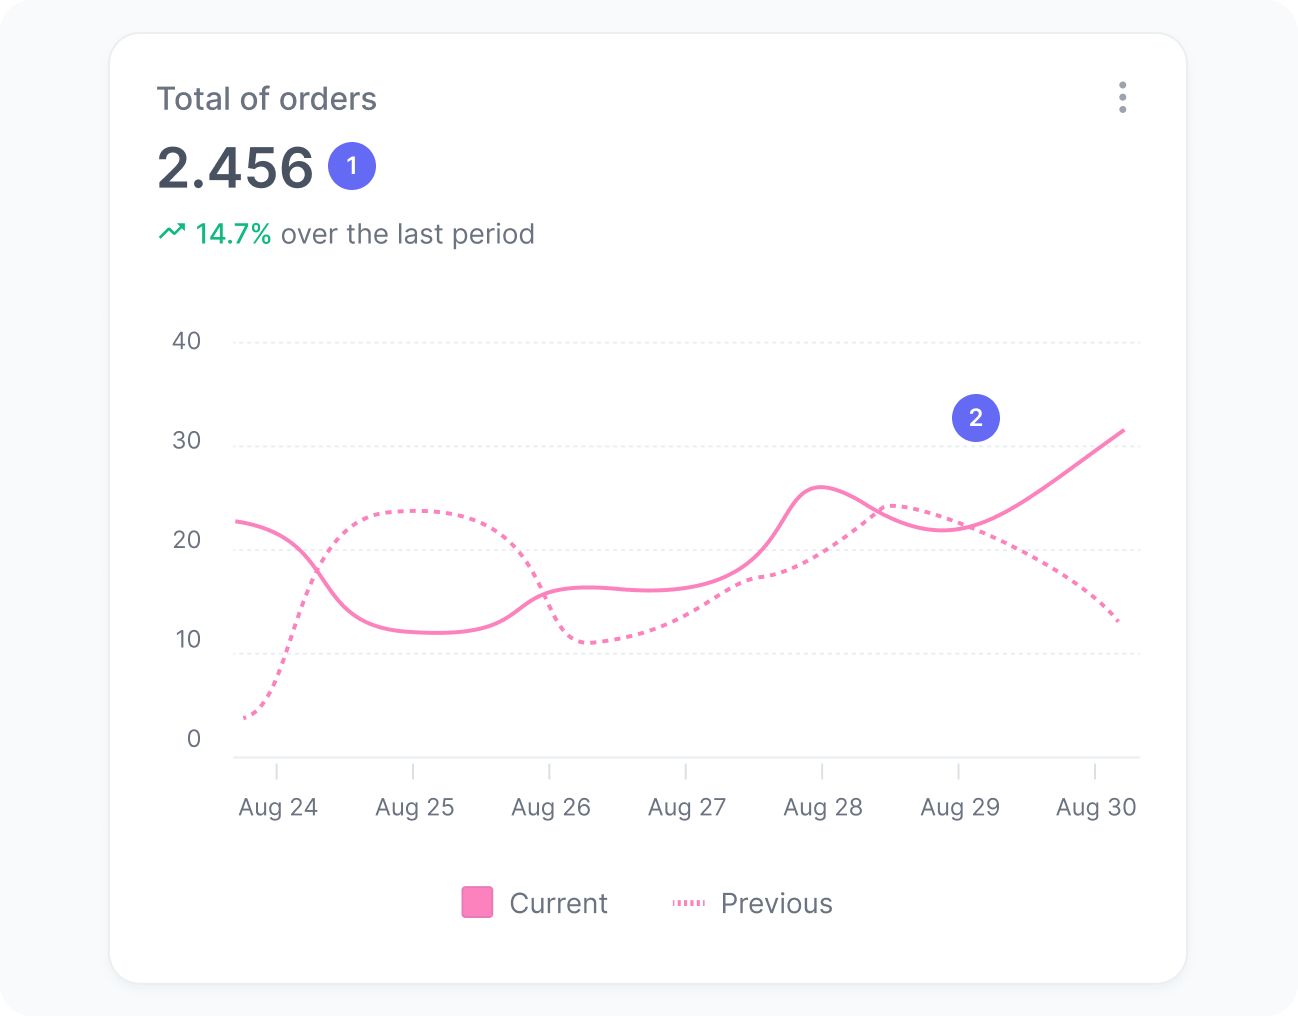
Total orders
Track the total number of orders placed across your applications.
Track the Order placed event to feed data into this widget.
This chart displays the total number of orders placed within the selected period.
It helps you monitor overall purchase volume and identify how user behavior evolves over time, regardless of whether experiences or experiments impacted users.
By analyzing total orders, you can assess the general health of your website performance, spot trends, and detect periods of growth or decline. This makes it easier to evaluate the effect of campaigns, seasonality, and site-wide optimizations.
Metrics
The chart includes:
- Total orders
The number of orders placed by your users. - Orders over time
A trend chart showing whether the number of orders is going up or down.
Interpretation
This chart helps you understand how your website's overall order volume changes over time. For example, after launching a new promotion or optimizing your checkout flow, you can track whether total orders increased. Conversely, if orders declined following a redesign or content update, it could indicate an unintended impact on user behavior.
What the number tells you
Here are some common insights you can get from this widget:
- An upward trend in total orders after launching a new campaign, promotion, personalization, or experimentation strategy, such as a rise from 1,000 to 1,300 orders per day, suggests that your recent marketing efforts are driving more purchases. Analyze which specific initiatives contributed to this growth to replicate their success.
- Stable order volume, for example, consistently around 1,000 orders per day despite an increase in sessions, may indicate that while your website is attracting more visitors, conversion rates are not improving. Consider reviewing the checkout experience, product visibility, or marketing strategies to identify opportunities for improvement.
- A decline in total orders, such as a drop from 1,000 to 800 per day following a design update, campaign change, or technical adjustment, could signal that recent modifications negatively affected user purchase behavior. Investigate possible friction points, such as usability issues, messaging clarity, or disruptions in the purchase flow.
- A drop in orders compared to the previous period may also be influenced by external or seasonal factors. For example, a lower number of orders might align with post-holiday slowdowns or the end of paid campaign cycles. Reviewing your marketing calendar and past performance trends can help you confirm whether the decline is expected or signals a deeper issue.
- On the other hand, an increase in total orders compared to the previous period could be a positive indicator of growth. Use this opportunity to identify what worked well, such as campaign timing, creative messaging, or pricing strategy, and determine how these elements can be scaled or applied to future initiatives.