Revenue
Track overall revenue across your applications.
Track the Order placed event to feed data into this widget.
This chart displays the total revenue generated over a selected period. It reflects the combined value of all orders across every application in your workspace.
Monitoring revenue over time is key to identifying fluctuations and trends in user behavior. It also helps you understand the monetary impact your marketing and growth strategies are having on the business, such as whether they are driving more purchases or increasing order values.
Metrics
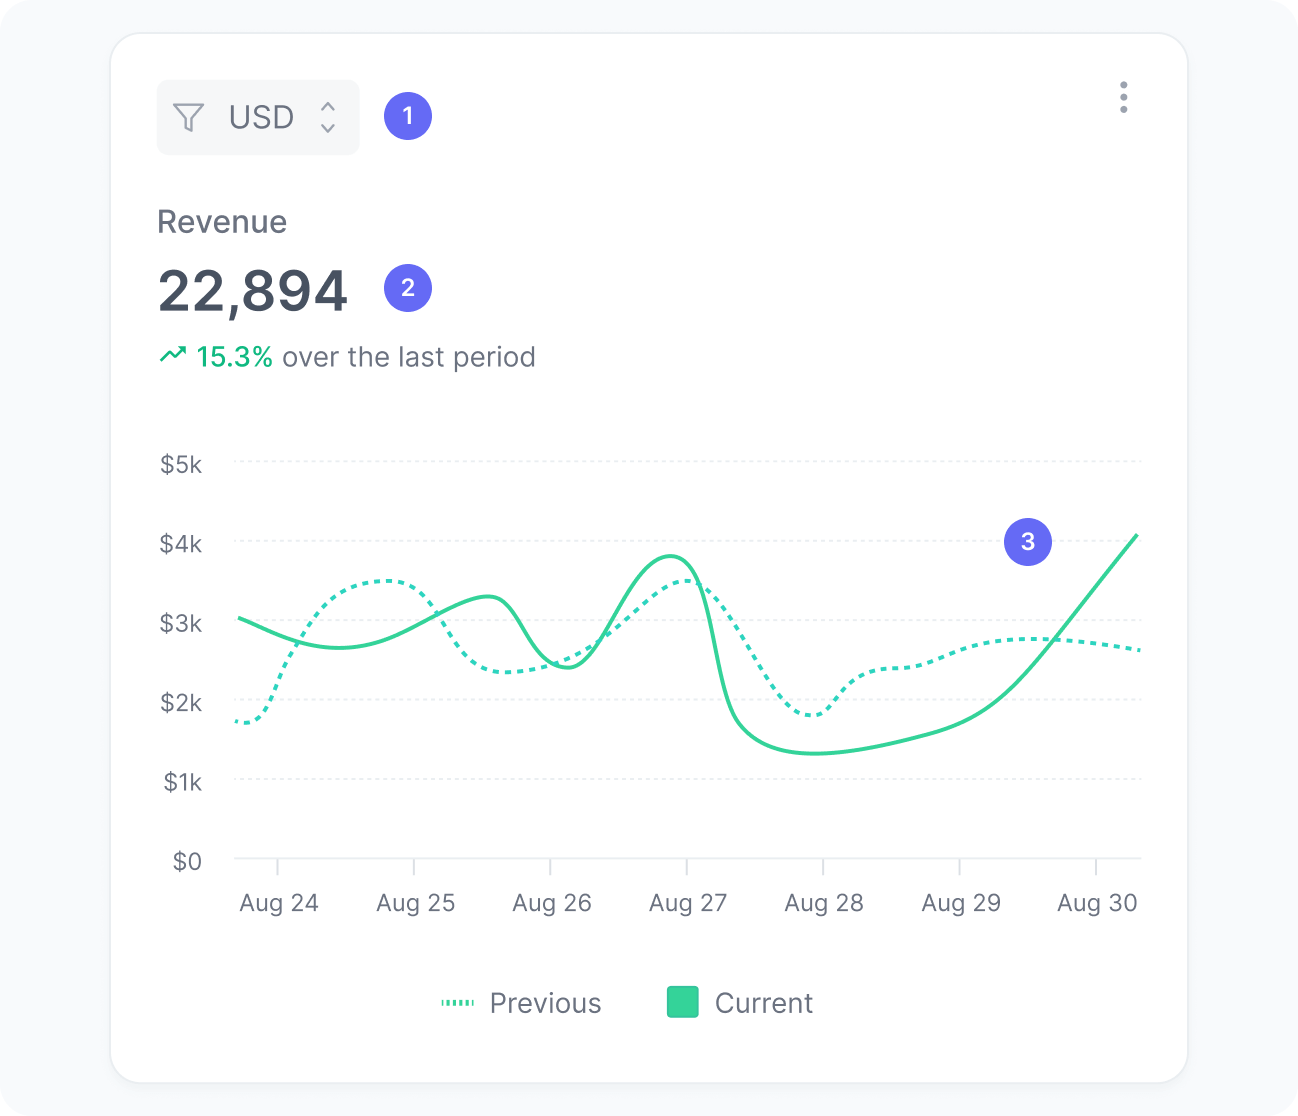
The chart includes:
- Currency
A filter to select orders in a specific currency. Values are never aggregated across currencies. - Revenue
The total revenue from completed orders within a given period. - Revenue over time
A trend chart showing whether your revenue is going up or down.
Interpretation
This chart shows the revenue generated from orders in the selected currency, helping you assess the impact of your marketing and growth strategies on sales. Fluctuations in this number can reflect changes in product pricing, discount strategies, user purchase behavior, or the performance of active experiences and experiments.
What the number tells you
Here are some common insights you can get from this widget:
- An upward trend in revenue after launching a campaign or making updates, such as an increase from $80,000 to $100,000 per week, suggests that your initiatives are leading users to buy more items or higher-value products. Analyze which actions had the strongest impact to identify growth opportunities.
- Stable revenue despite an increase in total orders may indicate a decline in average order value. This could mean users are purchasing lower-priced items or smaller quantities. Review pricing, discounts, and product mix to understand the cause.
- A decline in revenue, such as a drop from $100,000 to $75,000 after a campaign change, product adjustment, or technical issue, may signal a negative impact on user purchase behavior. Evaluate whether a promotion ended, if there were catalog or checkout updates, or if seasonality affected results.
- An increase in revenue compared to the previous period is a positive indicator of stronger performance. Examine which campaigns, channels, or user segments contributed most to this growth, and explore how those strategies can be scaled or replicated across other initiatives.