New users
Understand how many users are visiting for the first time.
The SDK automatically tracks the events that feed this widget.
This widget shows how many new users were active during the selected time window. We call new users those who interacted with your applications for the first time. It helps you understand how effectively your website is attracting new visitors and expanding its audience base.
Metrics
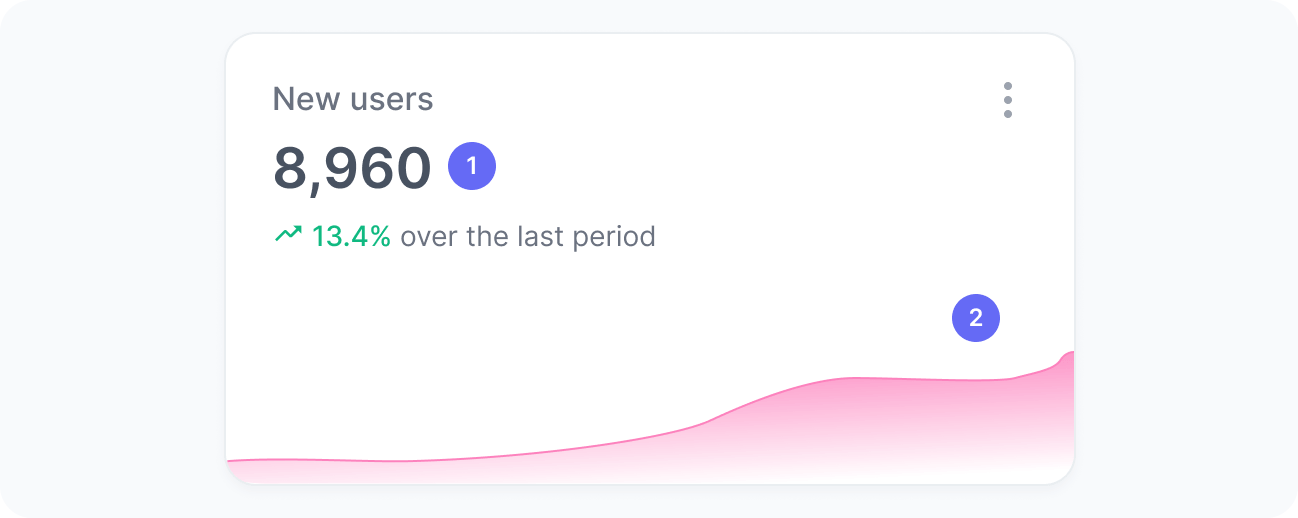
The chart includes:
- Total new users
The total number of users who visited your site or application for the first time. - New users over time
A trend chart showing how the number of new users evolved over time.
Interpretation
This chart shows how many users are discovering your site or applications for the first time in a selected period. It helps you evaluate acquisition performance and understand whether your marketing, growth, or SEO strategies are effectively reaching new audiences. Tracking this number over time reveals how your brand awareness and user base are evolving.
What the number tells you
Here are some common insights you can get from this widget:
- An increase in new users suggests that your acquisition strategies are working. For example, through marketing campaigns, SEO improvements, growth strategies, or increased brand visibility.
- A decrease may indicate reduced marketing investment, seasonal variation, or issues affecting discoverability, such as lower ranking in search engines or fewer referral visits.
- If the number of new users remains stable while active users increase, it suggests that retention is improving and more people are coming back rather than visiting for the first time.