Geographic distribution
Understand where your users are browsing from.
The SDK automatically tracks the events that feed this widget.
This widget displays where your users are located, helping you understand your audience's geographic reach and concentration. It highlights the top 10 countries, regions, and cities from which users accessed your applications during the selected period.
By analyzing this data, you can uncover valuable insights into where your traffic originates, which locations are growing in engagement, and where new opportunities for localization or regional strategies might exist.
Metrics
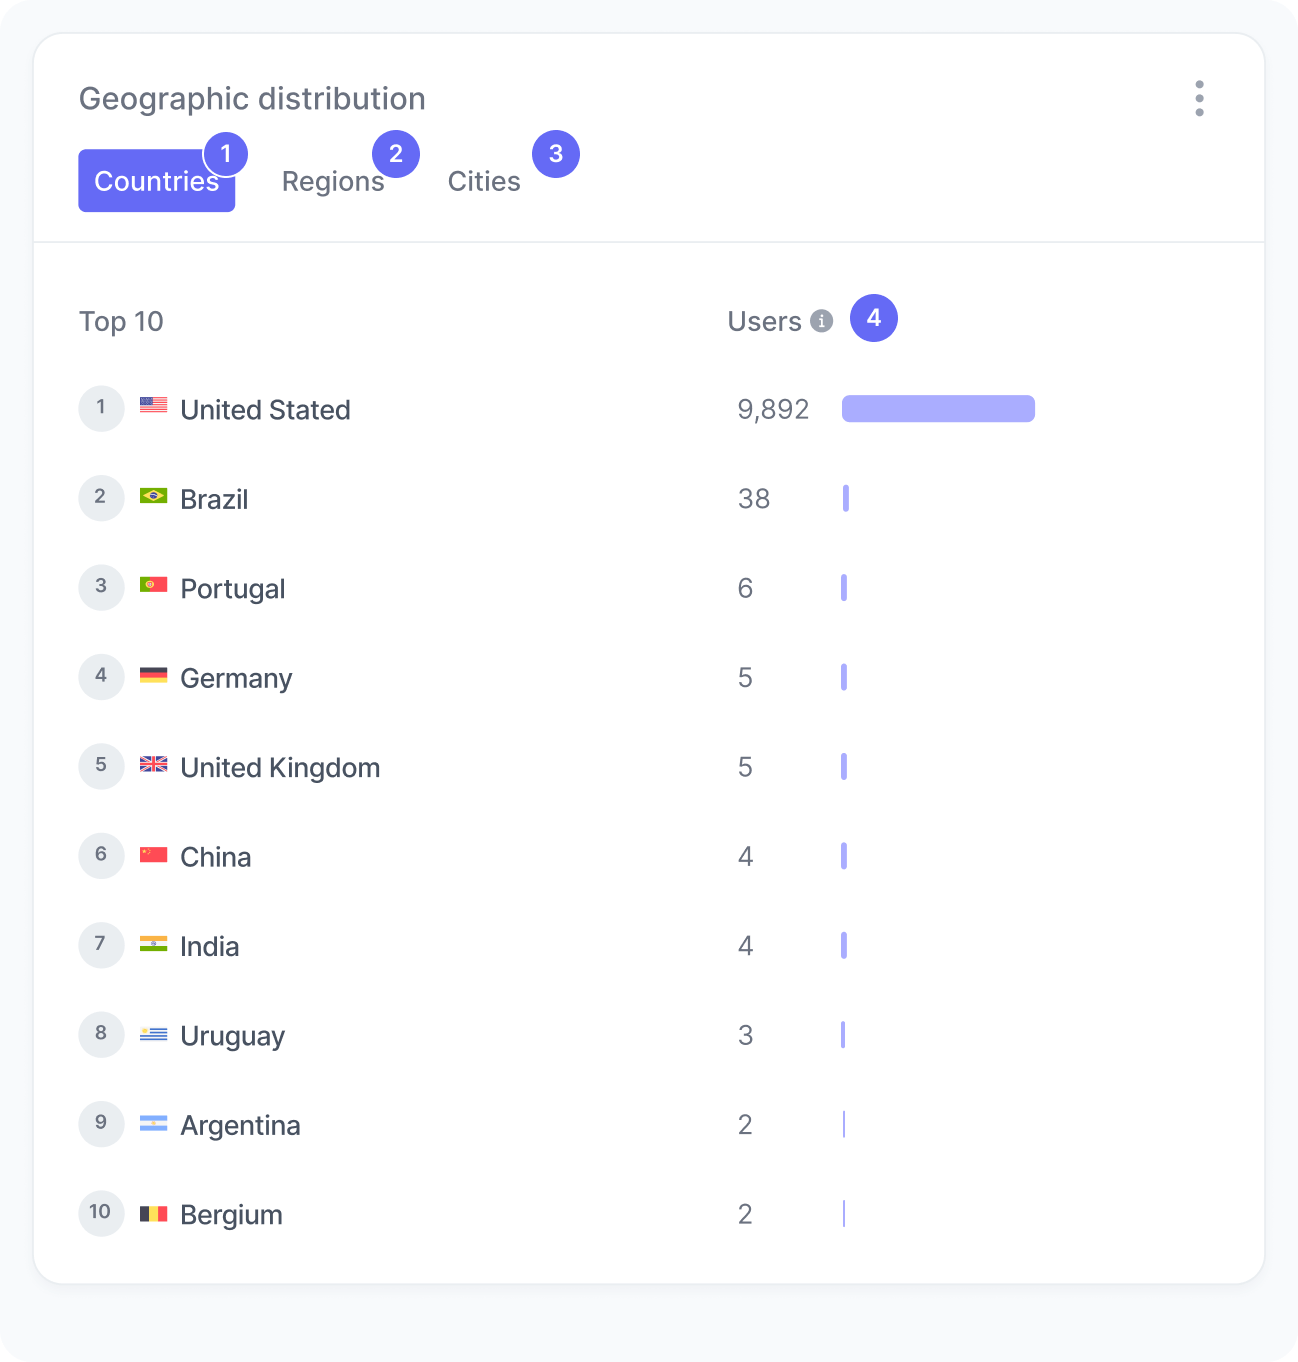
The chart includes:
- Countries
The top 10 countries where your users are located. - Regions
The top 10 states or regions of your users. - Cities
The top 10 states or cities of your users. - Users
The total number of users from each listed location.
Interpretation
This chart helps you visualize the geographic concentration of your audience and how it evolves over time. A strong presence in certain countries, states, or cities can indicate established brand awareness or successful local campaigns, while growing activity in new areas may point to expanding market reach.
For example, if you notice a surge in users from a specific region after launching a localized campaign, it suggests your strategy is resonating with that audience. Conversely, a decline in users from key markets might highlight the need to re-engage that region with tailored messaging or offers.
What the number tells you
Here are some common insights you can get from this widget:
- High concentration in a specific region indicates strong engagement and brand presence in that area. Consider deepening your strategy there with target experiences or optimization strategies.
- Emerging regions showing growth suggest expanding awareness or new audience discovery. You might explore additional marketing investment or personalization strategies to accelerate growth.
- Even distribution across multiple regions reflects a diversified audience base, offering flexibility to test regionalized content or campaigns and learn what performs best in each location.
- A drop in users from key markets could signal decreased engagement or reduced campaign activity. Review recent changes in targeting, offers, or experiences that may have impacted local traffic.