Device distribution
Understand how users access your application.
Automatically tracked
The SDK automatically tracks the events that feed this widget.
This widget shows the distribution of sessions by device, helping you visualize which devices, vendors, and browsers are most commonly used to access your application.
Metrics
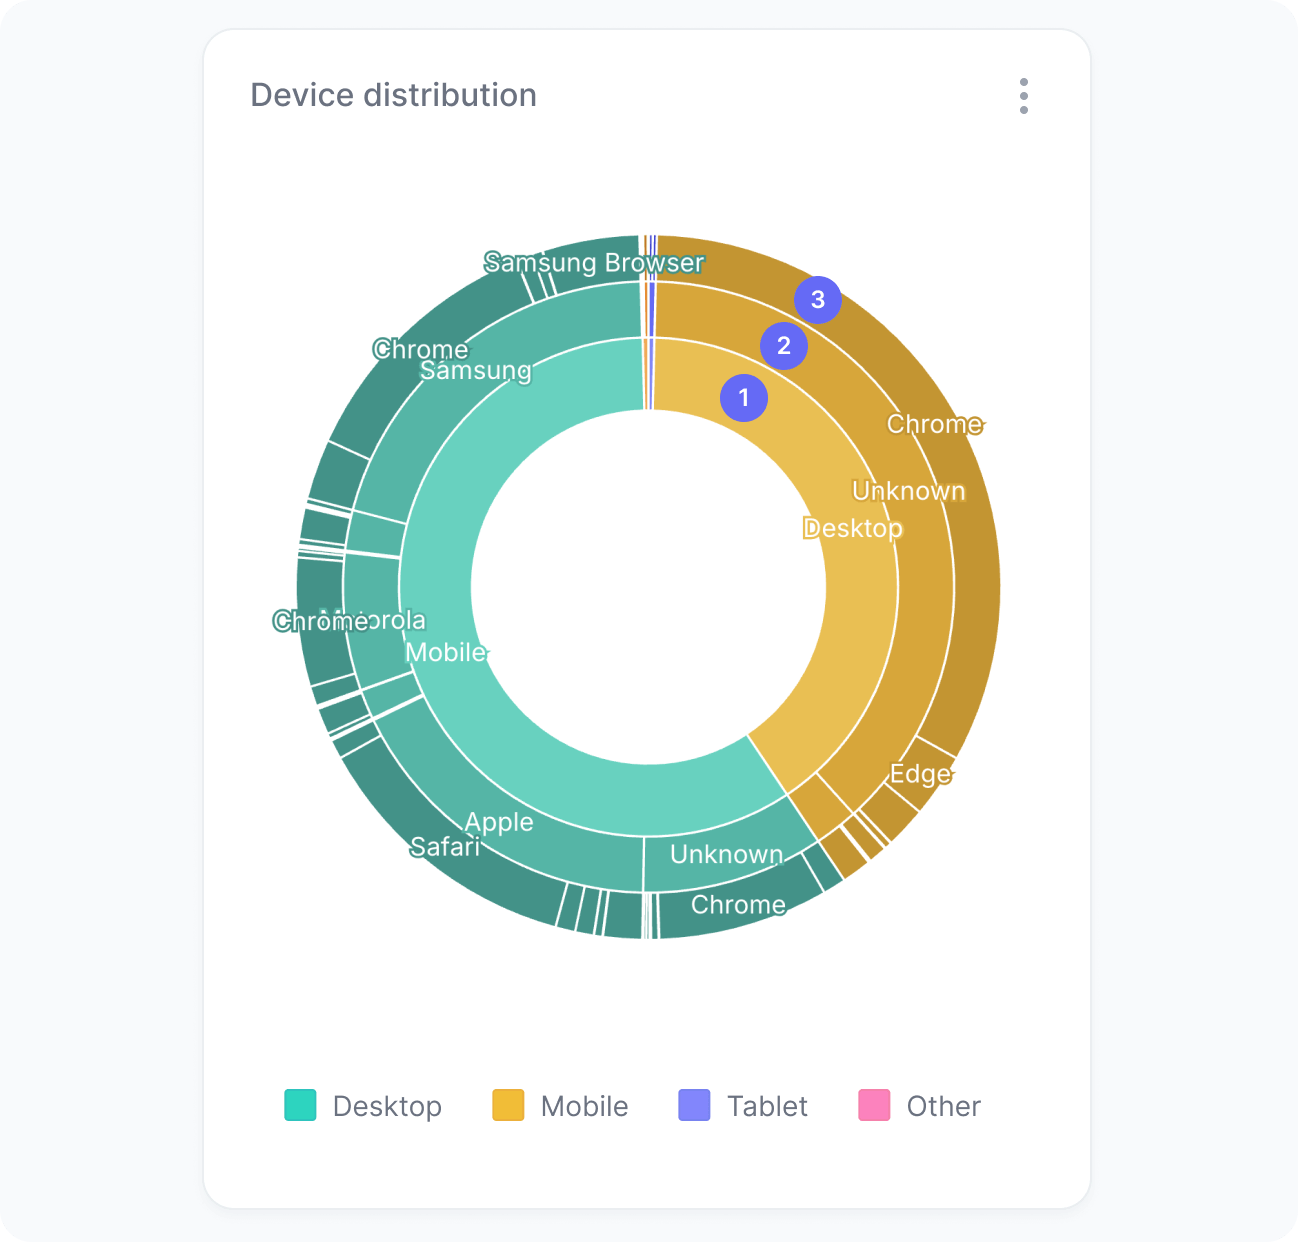
The chart includes:
- Device category
The innermost layer groups sessions by device category, such as mobile, desktop, and tablet. - Device vendor
The middle layer shows the vendors of the devices used by users, like Apple, Samsung, and Motorola. - Browser
The outermost layer displays the browsers users use to access your application, such as Chrome, Safari, and Firefox.
Interpretation
This layered view lets you drill down from broad device categories to specific browsers. For example, you can see what percentage of sessions come from mobile devices, then identify which vendors and browsers are most popular within that segment.
What the number tells you
Here are some common insights you can get from this widget:
- Concentration on one device type indicates a strong preference among your users, which can guide optimization efforts for that device.
- Device-behavior correlations may emerge. Mobile users often have shorter sessions or higher bounce rates than desktop users.
- Vendor distribution can reflect your audience demographics, since brands tend to attract different user segments.