Total sessions
Measure how many sessions your application receives over time.
The SDK automatically tracks the events that feed this widget.
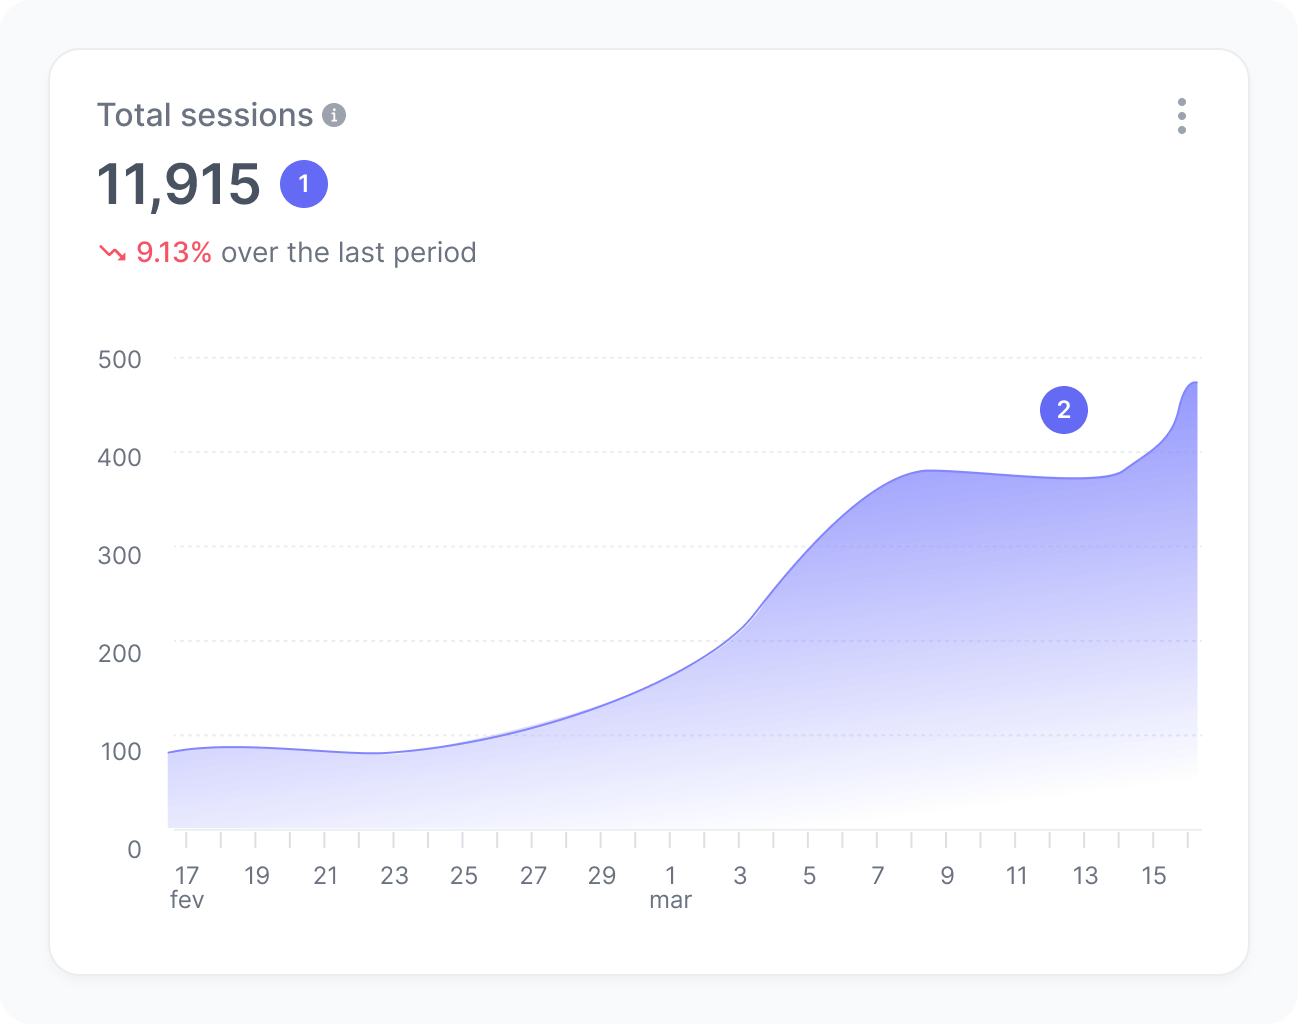
This chart shows how many sessions (or visits) occurred within your applications over the selected period.
This metric helps you understand your application’s overall traffic volume, showing whether your audience is growing, stable, or declining over time.
Metrics
The chart includes:
- Total sessions
The total number of sessions in your application. - Sessions over time
A trend chart showing how the number of sessions evolved throughout the period.
Interpretation
Imagine your application had 5,000 sessions this month and 3,800 sessions last month. This means your total sessions increased by 1,200, suggesting a growth in user engagement or a successful campaign that brought more users to the application.
Monitoring session trends helps you identify when your application receives more traffic, for example, after a feature release, marketing campaign, or seasonal event. A steady increase in sessions often indicates stronger user retention and growing interest in your application.
What the number tells you
Here are some common insights you can get from this widget:
- High or growing number of sessions indicates increasing user activity, possibly driven by new content, product updates, or marketing efforts that successfully attracted visitors to your application.
- A stable session volume suggests consistent user engagement and that your application maintains regular traffic patterns.
- A decreasing number of sessions may point to reduced user interest or visibility, or even a seasonal behavior. Review recent changes, releases, or campaigns that might have influenced user activity.