Experiences per session
Measure how many experiences affect users during each session.
The SDK automatically tracks the events that feed this widget.
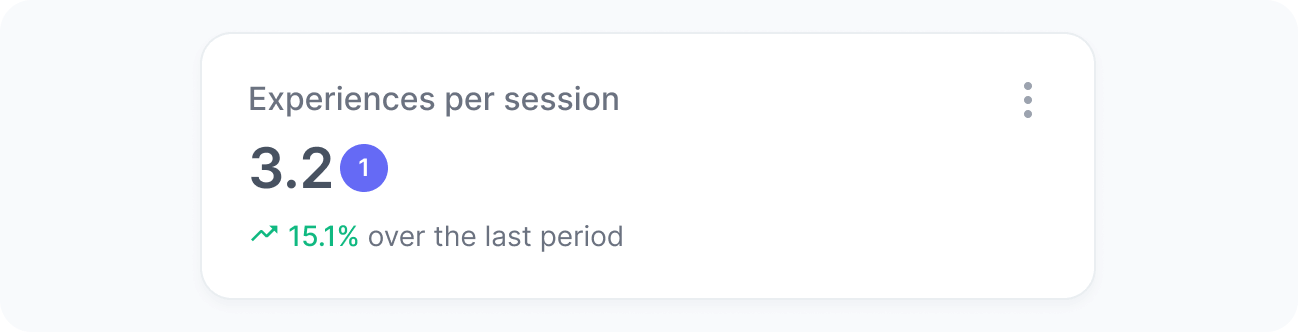
This widget displays the average number of experiences viewed per session during the selected period. It shows how frequently users encounter personalized experiences or experiments in your application, helping you assess the overall reach of your strategy.
The comparison with the previous period helps you understand whether their exposure to experiences is growing, stable, or declining over time.
Metrics
The chart includes:
- Experiences per session
The average number of experiences users see during each session in the selected period.
Interpretation
This metric shows how effectively your personalization and optimization efforts reach users. Track whether users are seeing more personalized content over time, or if their exposure has dropped due to fewer active experiences or narrower targeting.
What the number tells you
Here are some common insights you can get from this widget:
- An increase in average experiences per session could suggest that users are being exposed to more experience or optimization touchpoints, possibly due to new experiences being launched or expanded audience coverage.
- Stable average experiences per session indicate consistent exposure levels. This can be a positive sign if your personalization and optimization strategies are steady, but it may also suggest that your experience delivery isn’t expanding further.
- A decrease in average experiences per session may indicate fewer active experiences, narrower targeting, or technical issues limiting exposure. Review recent campaign or configuration changes that might have affected how experiences are being triggered.