Online users
Monitor how many users are currently active.
The SDK automatically tracks the events that feed this widget.
The widget displays the number of users currently active on your applications. It provides an instant snapshot of your live traffic, helping you understand peak activity moments and identify if real-time engagement is high.
Metrics
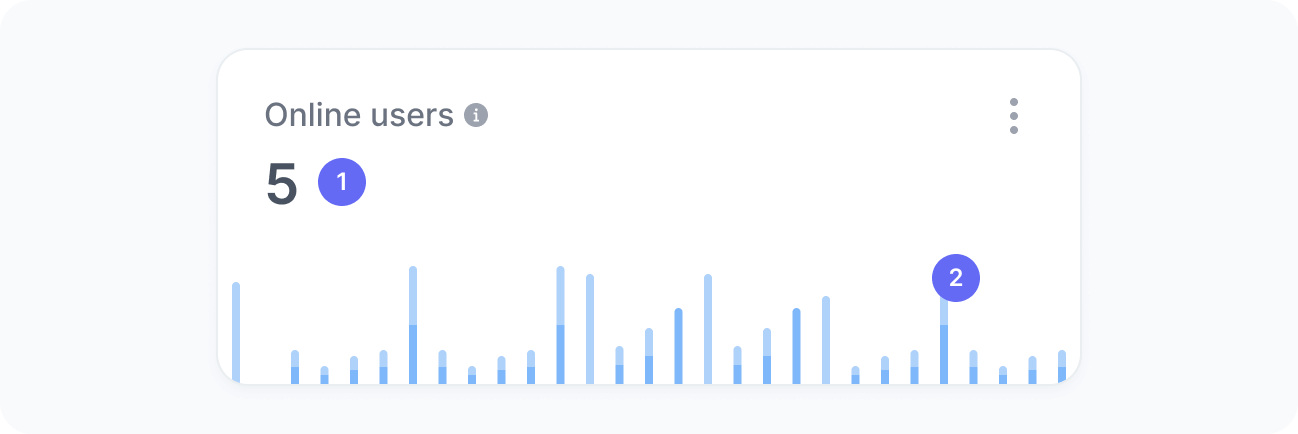
The chart includes:
- Total online users
The total number of users who are currently online. - Online users over time
A timeline showing how the number of online users has fluctuated over the past 30 minutes.
The chart uses two colors: dark blue for active users and light blue for idle users. Idle users are people who still have your site or app open but are not interacting with it.
Interpretation
This chart helps you understand real-time user activity and traffic trends. Spikes or steady patterns reveal how users engage with your app or site at different moments.
What the number tells you
Here are some common insights you can get from this widget:
- Sudden spikes in online users indicate the immediate success of a marketing action, campaign launch, or event. Use this moment to monitor performance and ensure your infrastructure can handle the increased load.
- Stable levels throughout the day reflect healthy and predictable user behavior patterns, which are ideal for planning updates or releases.
- Noticeable drops in online users may point to reduced visibility, lower campaign activity, or potential performance issues. Review recent changes that could have affected user access or engagement.
- A high share of idle users can suggest that people are taking time to review or compare information, exploring options before acting, or leaving your app open for future use, common for tools or resources that require reflection or ongoing attention.
This widget always shows the number of users active in your applications in the last 30 minutes, regardless of the filters applied.