Total leads
Track how many leads your applications generate over time.
Track the Lead generated event to feed data into this widget.
This chart shows the total number of leads generated across your applications during the selected period.
A lead typically refers to a user who has demonstrated an interest in your product or service by performing a particular action, such as filling out a form, requesting a quote, signing up for a newsletter, or registering for a waiting list.
This metric helps you evaluate how effectively your applications capture user interest and how your acquisition strategies perform over time. It’s especially useful for tracking the impact of marketing campaigns, UX updates, experiments, or personalized experiences on lead generation.
Metrics
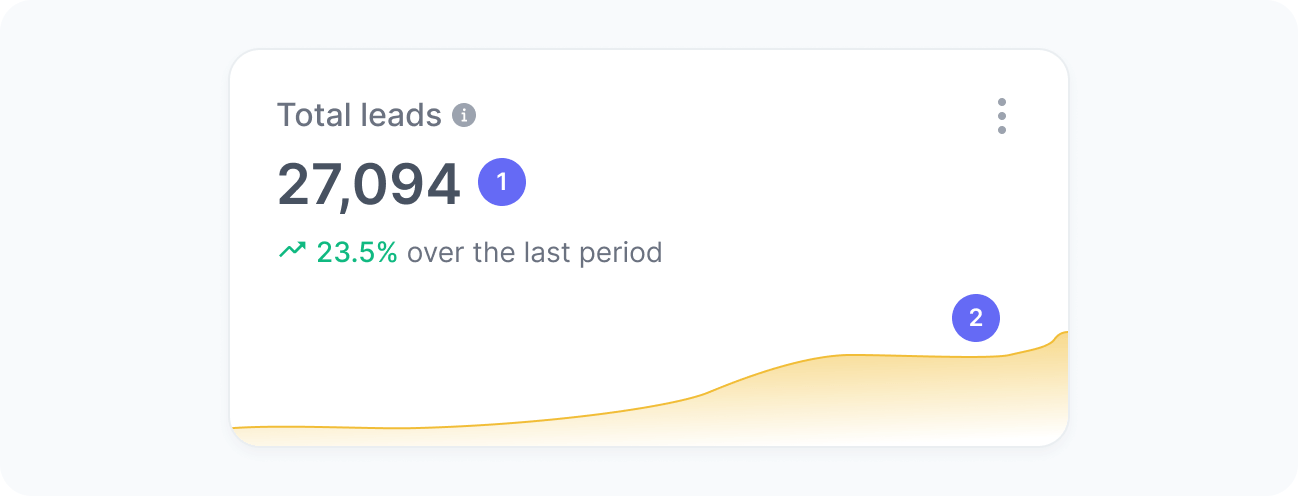
The chart includes:
- Total leads
The number of users who became leads during the selected period. - Leads over time
A trend chart showing the number of leads over time.
Interpretation
This chart helps you understand how your total lead volume evolves over time. For example, after launching a new campaign, promoting a new product, or optimizing a form, you can track whether total leads increased. Conversely, if leads decline following a redesign, content change, or experiment, it may indicate friction in your lead capture flow or reduced user interest.
What the number tells you
Here are some common insights you can get from this widget:
- A higher number of leads indicates strong acquisition performance and that your lead capture channels (such as forms, CTAs, and landing pages) are functioning effectively.
- A lower volume may suggest opportunities to optimize forms, clarify value propositions, or refine how and where you prompt users to convert.
- Tracking this number over time helps you understand how new campaigns, content updates, experiments, or personalization initiatives impact your ability to generate leads.